
Alphabet Inc ($GOOG) is one of the most successful companies in history. It originally started as “BackRub”, a research project that was started in 1996 by Larry Page and Sergey Brin when they were both PhD students at Stanford University in Stanford, California.
It is a part of the $NDAQ, with a market capitalization of $1.34 trillion and an all time high share price of $151.85.
It’s core business is online search and advertising but it also participates in artificial intelligence, automation, autonomous cars, biotechnology, cloud computing, computer hardware, corporate venture capital, healthcare, robotics and software.
Like every other company listed on the stock exchange, $GOOG has been affected by the market downturn spurred by inflation and quantitative tightening. In this article we take a look at the price action and probable path of the share price of the tech giant.
We start with a bird’s eye view from the yearly timeframe all the way down to the weekly, to decipher the momentum and the obstacles in the way of a rally back to the all time high and beyond.
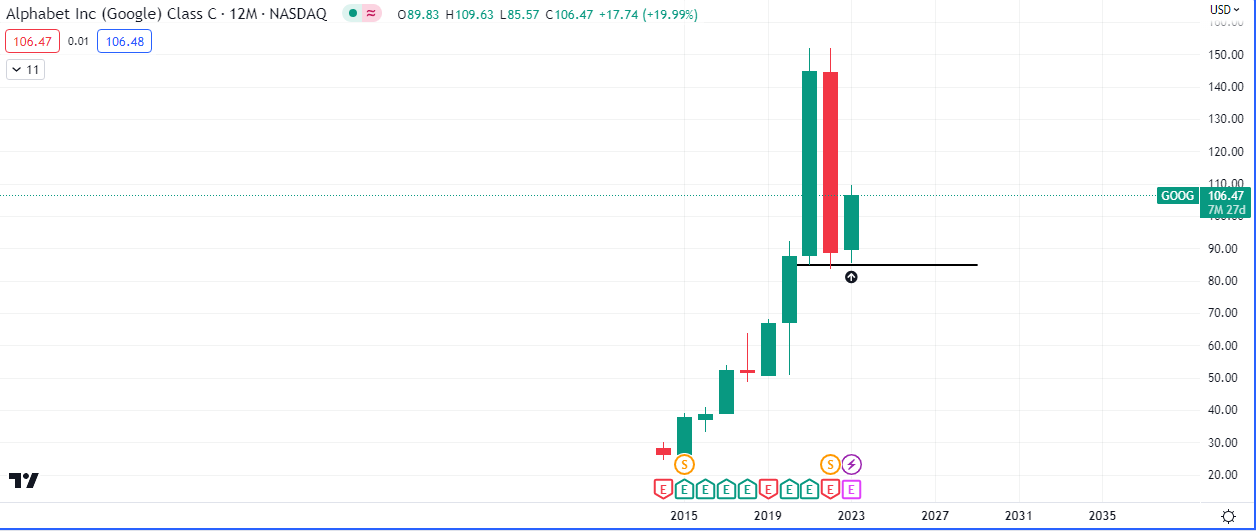
The yearly chart offers an extremely optimistic view, with a bullish rejection below the lows of the year 2021. 2022 was a bearish year and the gains made in the previous year, after the pandemic were erased, however the inability to close below $84.95 means the next likely bus stop is $152.10.
This is good news for the bulls, and those who bought at the top and are holding. This year has been bullish so far, as the US equity markets as a whole seem to be recovering on the back of a less hawkish federal reserve.
What we need to see now is a bullish close this year, anywhere above the opening price of $89.83 would do. The only thing that would stop the rally to the top, temporarily, would be ‘engineered liquidity’ or a sweep of the stop losses below last year’s lows.
Conclusion
Advantage to the BULLS for now on the yearly chart.
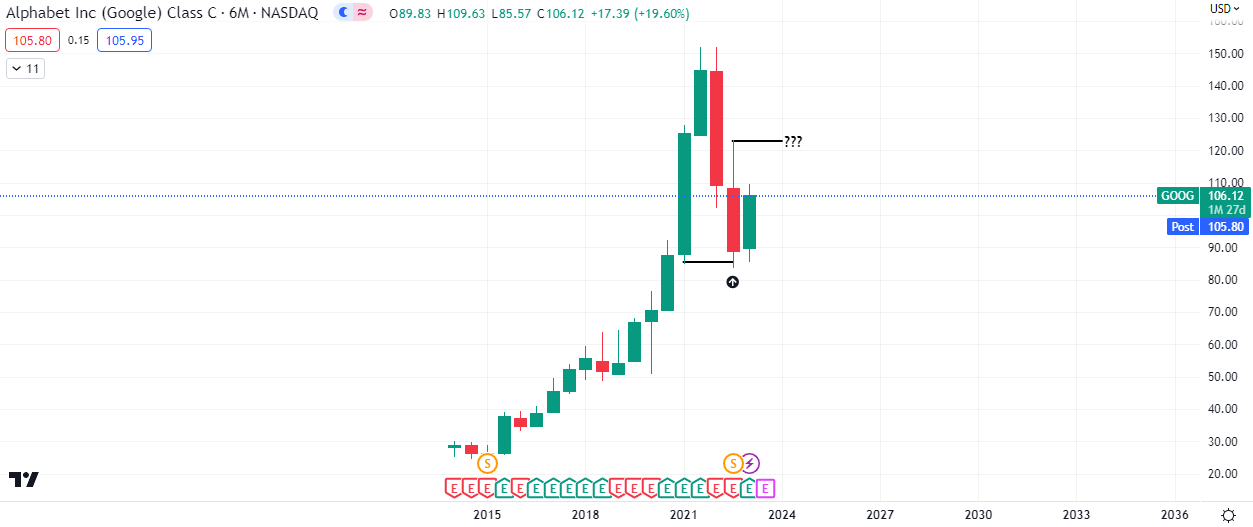
The 6 month chart also paints a rather bullish picture with a bullish rejection below the imbalance from 2021. It is more of the same narrative as we wait for a bullish close above this ‘half year’ candle in June. The next point of resistance on this timeframe is $123.
Conclusion
Advantage to the BULLS for now on the 6 month chart.
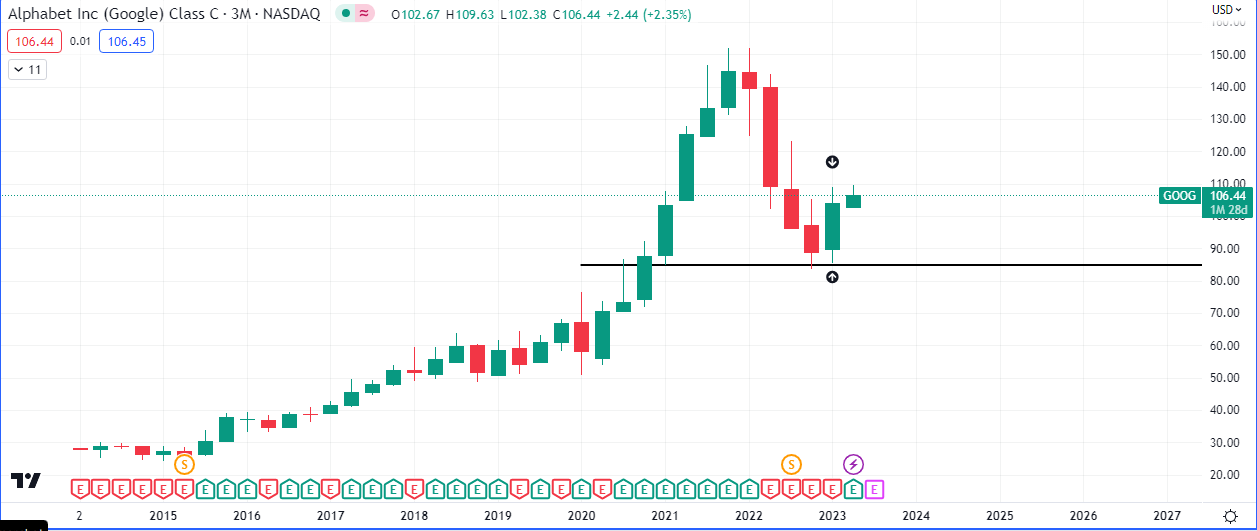
Things begin to get interesting here on the quarterly chart. The momentum is similar to those on the higher timeframes, with Q1 even closing green, signaling demand.
However when you look closer, you can see that the close of the Q1 could not close above the high of Q4 2022, which happens to be part of a series of bearish imbalance candles.
Q2 has so far been bullish but the bullish narrative requires price to close above the open of April, $102.67, by the end of June. If this occurs then we can expect demand to markup price to $112.87, the highs of mid 2022.
If price closes below $102.67 by the end of June then price likely will drop to $83 and possibly $71 to seek liquidity.
Conclusion
Advantage to the BEARS for now on the quarterly chart.
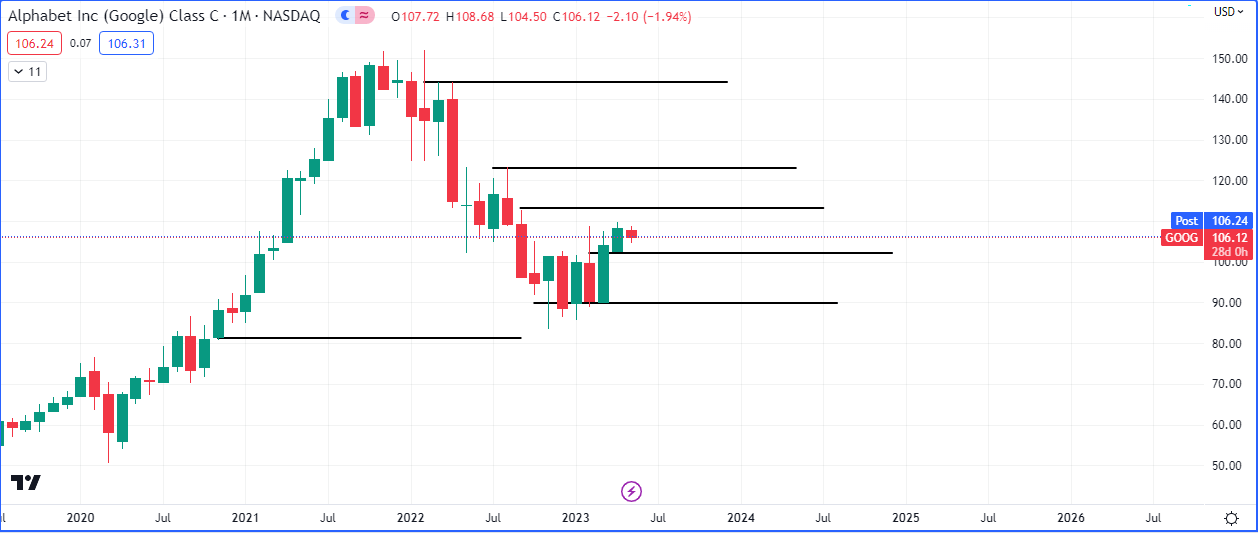
The monthly timeframe is the least eventful of the lot, with no particularly clear break of structure. However it is technically advantageous to the bulls since March and April were two bullish candles that formed a small imbalance.
The next resistance to watch out for on this timeframe is around $110 but lower retests to the lows of March and April can occur, before a rally into the resistance overhead.
Conclusion
Advantage to the BULLS for now on the monthly chart.
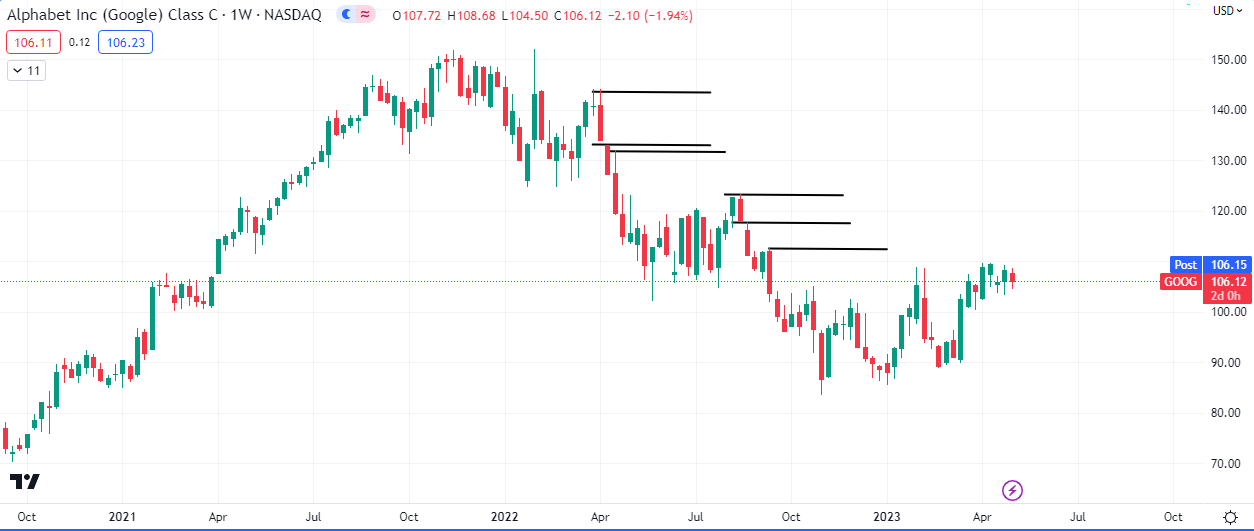
The price clusters on the weekly timeframe shows that 2023 has formed a break of structure that should support price to around $125, where the next strong weekly resistance lies.
The resistance at $107 can however reject price and push it down to test $99 and $90.
Piecing it all together
The higher timeframes paint a picture of strong demand despite the macro economic headwinds around the world at the moment, however the quarterly chart has raised some interesting questions.
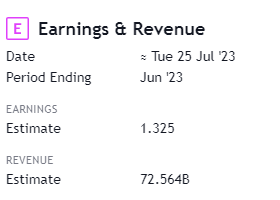
Will the quarter end bearish in June? How low will price go if it does end bearish? With the next $GOOG Earning and revenue report coming up on the 23rd of June, what can we expect to happen if there is a big miss/surprise to the upside or downside?
From the look of the market structure, the buy stops (liquidity) on the widest range bar on the yearly and 6 month chart, has been mitigated so it is likely that we may see a couple of bullish years. However if the quarterly chart, or even the resistance on the 6 month at $123, turns price downwards and liquidity is sought out at levels such as $72 or $50, we may see a multiyear consolidation.
View some of our other stories on Alphabet ($GOOG) here.

The price clusters that can be seen on the weekly timescale suggest that 2023 has produced a break of structure, which should support price to about $125, which is where the next significant weekly resistance can be found.