
Candlestick patterns are a charting format that shows the opening, closing, high and low price of an asset. Its origin is widely attributed to a Japanese rice trader called Munehisa Homma in the 18th century.
Description
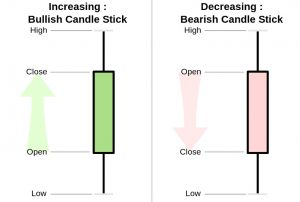
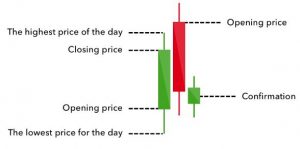
A candle stick forms by first depicting the open, followed by the high and low and then the close. The area between the high and the close is called the ‘body’ while the price areas above and below the ‘body are called the ‘shadows’ or ‘wicks’. The wicks illustrate the high and the low.
The price range is the distance between the upper shadow and the lower shadow and it is calculated by subtracting the low price from the high price. If the asset closed higher than it opened then the body is hollow and if the asset closed lower than it opened then the body is solid or filled. A trader may choose whatever colors they want for the candles from the setting of their charting platform.
When observed in combinations, traders can glean information about the price of the asset to make forecasts.
Here are some candlestick patterns that traders should know for use in their forecasting.
Bullish Candlestick Patterns
Please note that although candlestick patterns form on all timeframes, they are more powerful on the higher timeframes (Yearly, Monthly, Weekly, Daily). The illustrations below are from the daily timeframe and are indicative of intraday price action.
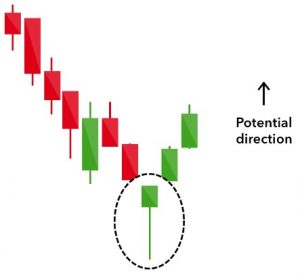
Hammer
Hammers are usually found at the bottom of downtrends and are characterized by a short body with a longer wick. It shows that although there was selling pressure in the background, ultimately a strong buying pressure drove the price back up. Hammers can be red or green but a green hammer indicates stronger potential bullish reversal.
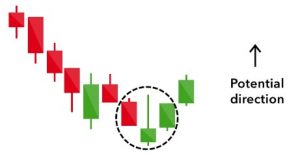
Inverse Hammer
The inverse hammer is the inverse of the hammer candlestick pattern. What differentiates this from the regular hammer is that its upper wick is its longer upper wick and shorter lower wick. It depicts buying pressure followed by selling pressure and that was not strong enough to continue the downtrend. It indicates that buyers will soon have control of the market.
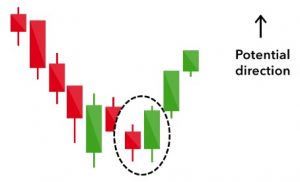
Bullish Engulfing
The bullish engulfing pattern is a two-candle formation. The first is a short red candle followed by a large green candle that completely engulfs the previous red candle. It is indicative of an obvious win by the buyers.
TOP 100 Dividend STOCKS To Consider In 2023
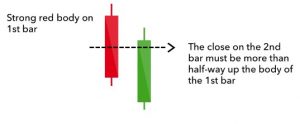
Piercing Line
The piercing line is another two-candle formation that is made up of a long red candle immediately followed by a long green candle. There is a gap between the close of the first candle and the open of the second candle, followed by a push up to at least the midpoint of the red candle. This indicates a strong buying pressure.
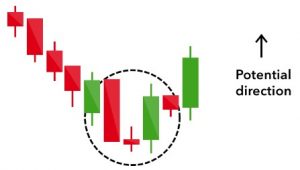
Morning Star
A morning star pattern is a three-candle formation and it is considered a sign of a possible trend change from bearish to bullish. It comprises one short bodied candle long red candle and a long green candle. Normally, the star will have no overlap with the longer bodies as the market gaps on both the open and the close.
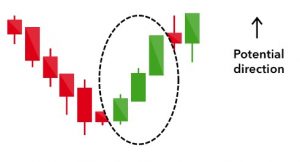
Three White Soldiers
The three white soldiers candle formation is a formation that forms over three candles. It is made up of three consecutive bullish candles with little or no wicks that open and close progressively higher than the previous candle. It is a very bullish signal that shows a steady advance of buying pressure. It shows an ‘imbalance’ of power between the bears and bulls in favor of the bulls.
Bearish Candlestick Formations
Bearish candlestick formations are indication of pessimism or resistance near the top of an uptrend. It is a sign of pessimism among traders who are closing their long positions to open short positions.
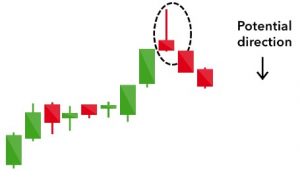
Hanging Man
The hanging man is the bearish counterpart of a hammer, having the same shape but forms at the bottom of a trend. It indicates a sell off countered by buyers who are still able to push up price again. It can be viewed as an indication of the bulls losing control of the market.
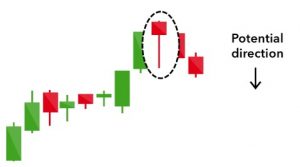
Shooting Star
The shooting star has a small lower body and long upper wick and it is the same shape as the inverted hammer. It is formed in an uptrend and the market usually gaps higher on the open to rally to an intraday high and to open at a price just above the open, much like a star falling to the ground.
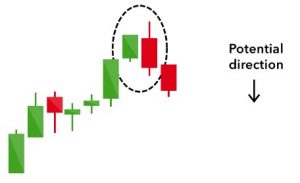
Bearish Engulfing
The bearish engulfing pattern is a two-candle formation that forms at the end of an uptrend. The first candle has a small green body and the second one has a large red body that totally engulfs the previous red candle. It is indicative of a slowdown of the bullish trend and the potential commencement of a bearish downturn. The larger the red candle is the more powerful the formation.
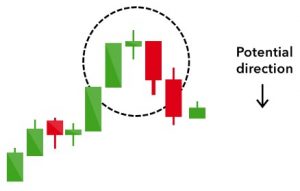
Evening Star
The evening star is the equivalent of the morning star. It is a three candle formation that consists of a short candle sandwiched between a long green candle and a long red candle, in that order. When the red candle completely erases the gains of the green candle it shows that the downtrend is likely to continue.
Three Black Crows
The three black crows candle formation comprises of three consecutive bearish candles with little or no shadows that open and close consecutively lower. This represents an ‘imbalance’ between buyers and sellers in favor of the sellers.

Dark Cloud Cover
The dark cloud is a bearish reversal, a gathering storm over the previous candle’s optimism. It is a two-candle formation: a red candle that opens gap up and closes around or lower than the midpoint of the previous day’s bullish candle. It is indicative of a takeover by the bears and the smaller the shadows on the red candle the more powerful the downtrend can be.
Candlestick Continuation Patterns and Indecision Patterns
So far we have discussed reversal patterns. Now we will discuss two continuation patterns and indecision patterns. These patterns may indicate a pause to refresh after an uptrend or a downtrend, depending on the situation.
Doji
The Doji is a pattern with a very narrow range between its open and close with wicks of varying length. It shows a struggle between buyers and sellers no net gains for either side. As a standalone figure, this cross-shaped formation shows neutrality but it can be found in combination with bearish and bullish reversal patterns.

Spinning Top
The spinning top is comprised of a short body between wicks of equal length. It is an indication of indecision in the market, resulting in no particularly notable change in the market. They are benign consolidation patterns that signify a period of consolidation or rest. However, depending on where they appear it could signify the beginning of a loss of control by either the bears or the bulls.
TOP 100 Dividend STOCKS To Consider In 2023
Conclusion
Candlestick charts can be very useful when mastered and used appropriately. They show a lot of information about the interaction between buyers and sellers and when they are used in concert with other tools, they are a key addition to any trader’s arsenal.

Leave a Reply