
There are a plethora of data points for traders to peruse when analyzing the markets. One of the key ones, in our experience, is correlations, as they present evidence of institutional sentiment and actions, when viewed in the right context.
The EURUSD currency pair closed slightly higher than its open last week after 2 consecutive bearish weeks. What made this bullish close of the weekly candle, marked in the red circle in the chart below, interesting, was that the high beta currencies, Volatility(VIX), Crude oil, and the German 10Y Bonds(DE10Y) all closed in negative territory. Hence the spread opportunity.
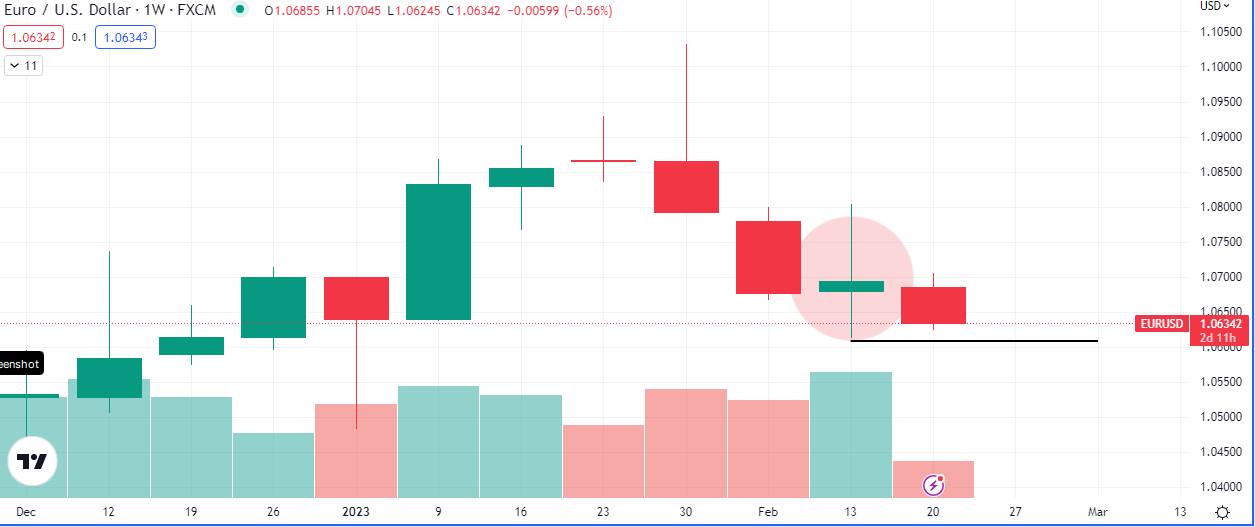
On the technical side of things the high of two weeks ago was swept and price could not close above the area of ‘imbalance’, indicating a possible drop. So far this week we have had two days of downward pressure and it looks likely to continue today.
The US services PMI already came out positive and stronger than expected at 50.5, which was higher than the forecast of 47.3. This further strengthened the already rampant US dollar. Other releases to watch out for include the FOMC Meeting Minutes today, the Preliminary GDP q/q and the Core PCE Price Index m/m, on Thursday and Friday respectively. Positive numbers on those will increase the likelihood of further rate hikes in the coming quarters of 2023.
The target for this directional bias for EURUSD is the low of last week at 1.06126. A sweep of that low will then have to be assessed in tandem with the broader market again to gain our next insight for directional bias.

Leave a Reply