

The volatility index ($VIX), otherwise known as the ‘fear’ index is at a crossroad. The technical junction in focus is the test of 25.310 and the ramifications of a close above or below this level is probably going to be huge.
Today’s close affects both the daily and weekly technical situation on the chart below, the monthly close on the 31st of this month, next week Friday, also had massive implications. Let us take a look at the monthly chart first and work our way down lower.
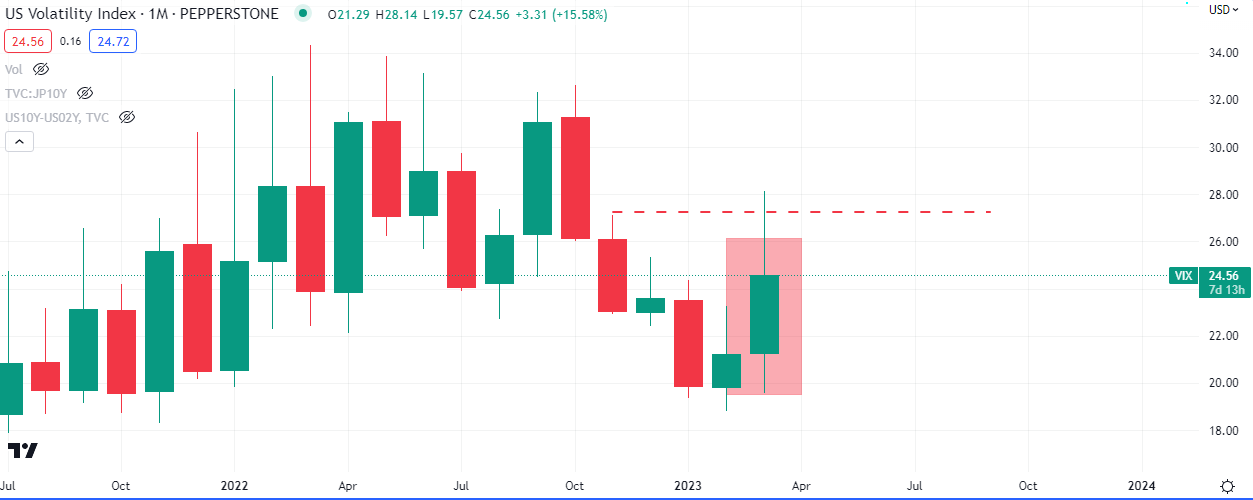
The monthly chart currently offers equity bulls some hope. If it closes as is, and it likely wont, then we can expect stocks to rally through some portion of Q2 2023, as we would likely see a drop in volatility. If the unlikely opposite occurs and we have a bullish close by the end of April, then that spike in volatility would carry through into at least the middle of the year. This outcome would mean a stock market crash to the tune of -15% at least.
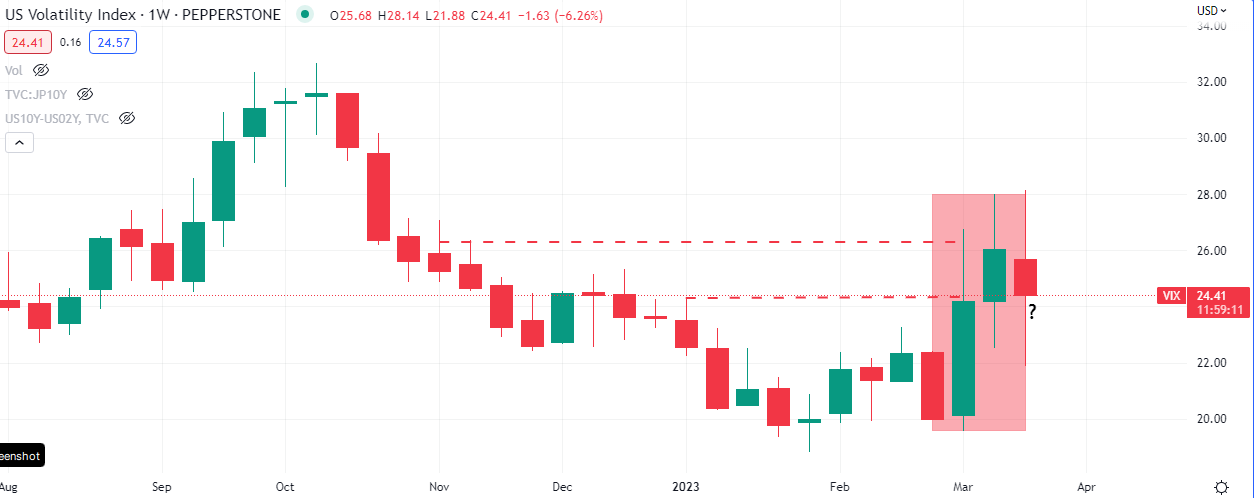
On the weekly chart the situation from last week’s close was bullish, as buyers kept coming into a market that looked primed to reverse in the short term. This week’s close, today, is important because should it close bearish then we can expect further spikes to the downside and that would be bullish for a stock market that is already showing some resilience in the face of all the uncertainties in the macro economic spheres.
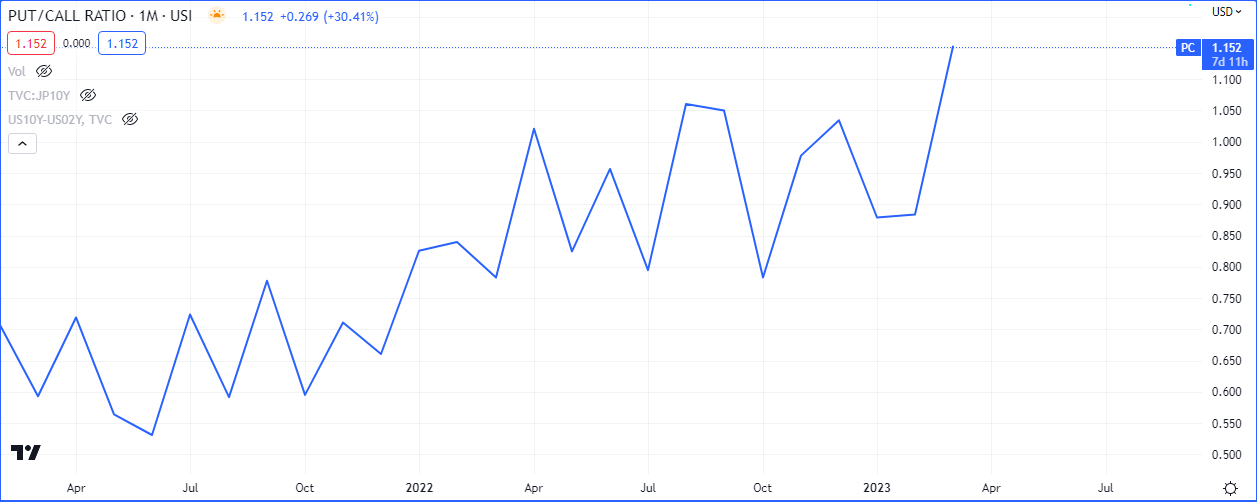
The Put to Call ratio shows that traders have been buying a lot of put options relative to call options. This may be in anticipation of a drop in the markets as they hedge their buy side exposure. This ratio typically has a negative correlation with stocks, so we need to watch this relationship even if volatility ends up suggesting we are in a bullish market.
Other related markets affected by this relationship include;
US TREASURIES
EURUSD
GBPJPY
OIL
CRYPTO CURRENCIES
Currency, bond and commodities traders may use this relationship to inform some of their directional biases.
Conclusion
Although the market looks poised to go bid as some level of ‘confidence’ was restored by the Fed led bank bailouts and Yellen’s concession that the US treasury would likely secure bank deposits across board, it would be prudent to watch how the market internals are jointly reacting.
Today’s close on $VIX, above or below 25.310, will be key hint in determining the sentiment and direction of the market for the next quarter of the year.


Leave a Reply