

The share price of the ‘Red Devils’ has benefited immensely from swirling rumors making the rounds about an imminent total takeover by Qatar Sports Investments. The news started making the rounds last year and has seen the share price of the highly decorated football club rally by over +70%
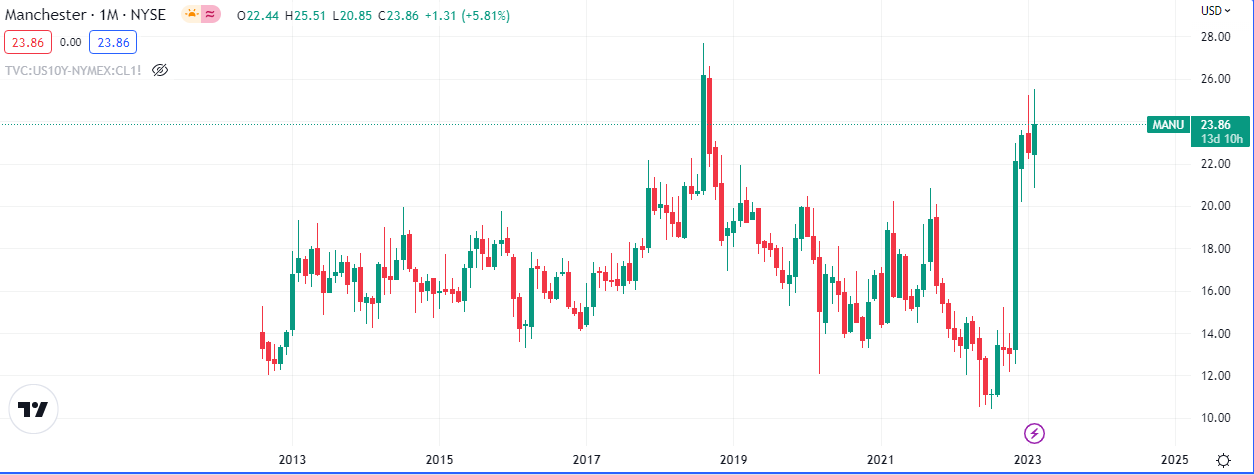
The stock which was listed on the NYSE in late 2012, has an all time high price of $27.70 and it has clawed its way back quickly from $10 to $23 since August last year.
The football club has had a relatively unsuccessful period over the last decade, at least when compared to it’s glory days under it’s maverick coach, Alex Ferguson. Much of that may be attributed to the transition phase they found themselves in when the gaffer retired. This was followed by a string of unsuccessful hires like David Moyes and Louis van Gaal, which left the club trailing it’s local and international rivals like Arsenal, Liverpool and Chelsea
It’s share price was in a fairly tight range for the last 9 years, testing $19 thrice between 2013 and 2017and peaked at $27.69 in August, 2018.
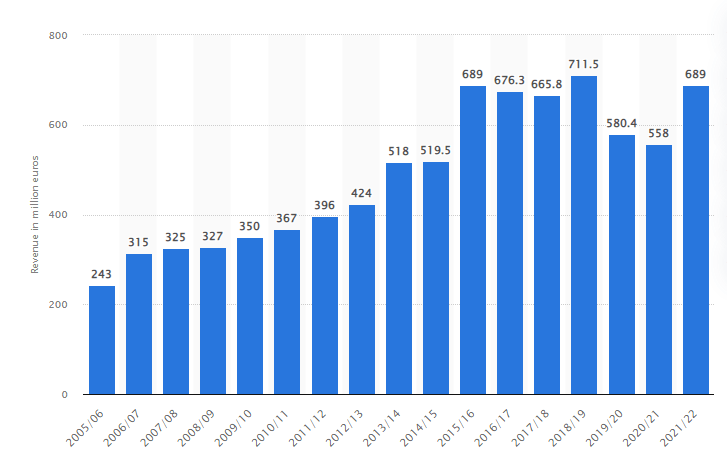
The Manchester club generated a record €711 million in the 2018/19 season but saw revenue drop for two successive seasons after that to €580.4 million and €558 million. Revenue increased in their 2021/22 season to equal their 2015/16 season at €689 million.
With their new manager, Erik ten Hag, things seem to be improving as they sit in 3rd place behind defending Champions Manchester City and league leaders Arsenal.
How to trade this stock
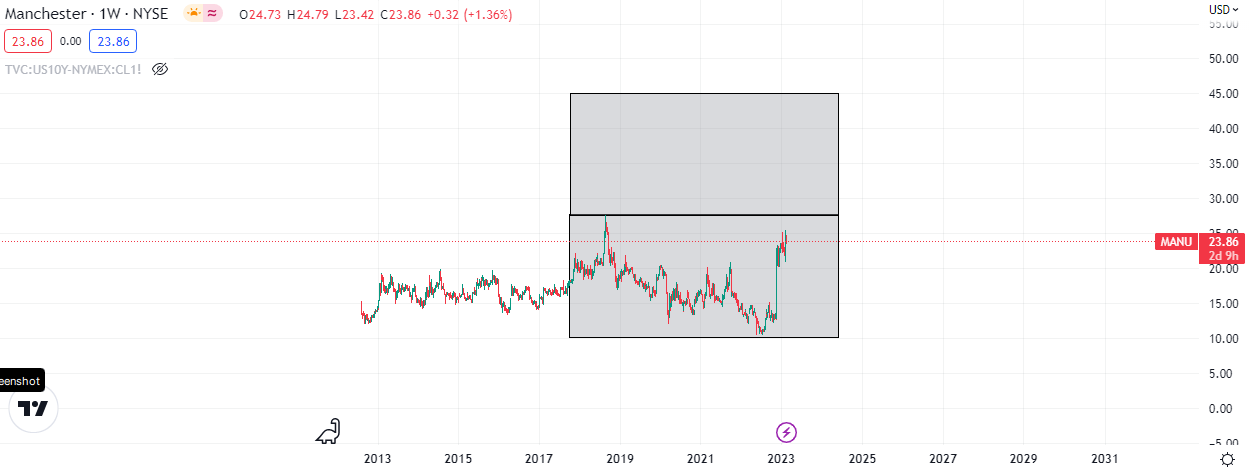
There have been no confirmations of the said acquisition and the long term success of the club, though likely, is not guaranteed, so an objective approach would be pragmatic. A successful campaign/season would be a good catalyst as well as strong company intrinsic values like increased earnings, spear headed by publishing rights, jersey and merchandise sales, and good old technical analysis. That being said the Weekly chart does look bullish with a possible measured move towards $45, over the next couple of years.
This article is not intended to be and does not constitute investment advice. You can lose more than your initial investment in the capital markets. Do your own research.

Leave a Reply