
Nvidia (NVDA) is up 42% this year, despite losing 50% last year. The tech company designs and sells GPUs for gaming, crypto currency mining, and professional applications, as well as chip systems for use in vehicles, robotics, and other tools. It’s leading position in high end artificial intelligence, a $600 billion industry, and better than expected quarter and guidance, saw the stock rise 14% early in the trading session today (Thursday). The company plans to build DGX complexes in clouds to capitalize on generative AI.
Analysts from Goldman Sachs and Susquehanna are touting the stock for it’s resilience and the latter is targeting a per-share price of $280. They singled out future growth potential in generative artificial intelligence, professional visualization, data centers, automotive and embedded and gaming, as the reasons for their optimism. They expect operating margins to remain intact and operating expenses to be flat in the coming quarters. Sales in Q1 are expected to be around $6.5 billion.
Price Action (Key Closes)
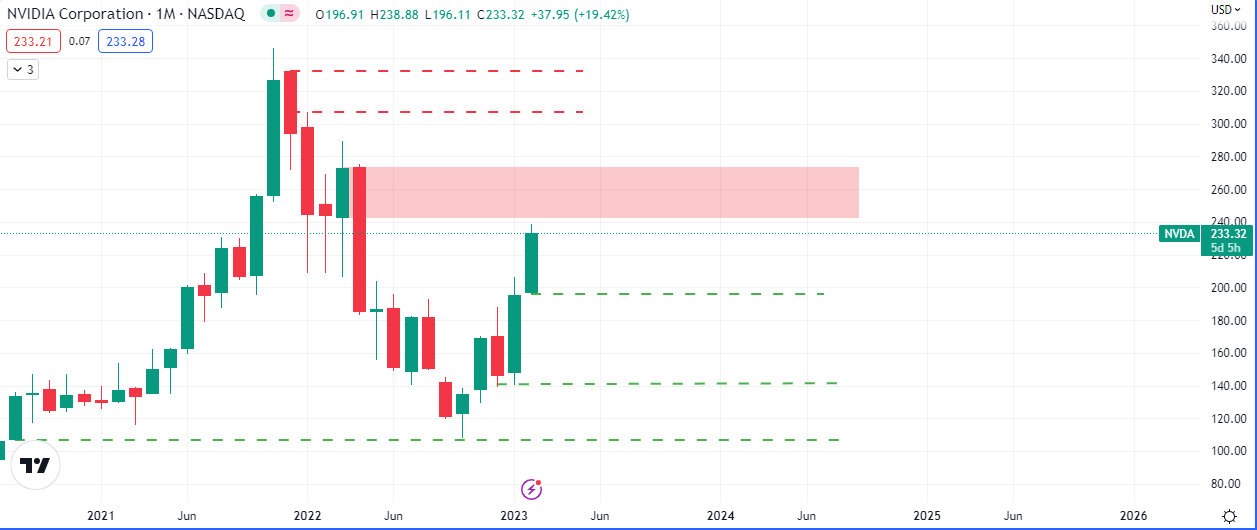
On the Monthly chart, a close above $242.91 would probably support price towards $273.75. A close above the latter, $307.11 and $332.89 takes price, probably, to $590/share.
On the flip side of the coin, if price tests and does not close above $241.91, we expect price to drop to $146.14, depending on whether it can close below $196.11. Not closing below $196.11, $146.14, $138.84,$129.56 or $108.13, restarts the probably markup to $307.11 or higher.
The breach of $108.13 in September 2022 formed and probably is a resistance that will be revisited at some point in the near future. The price ranges of October, November, January and February formed imbalances and their lows are now a ‘treasure-house’ of liquidity waiting to be absorbed before a possible continuation up or capitulation.
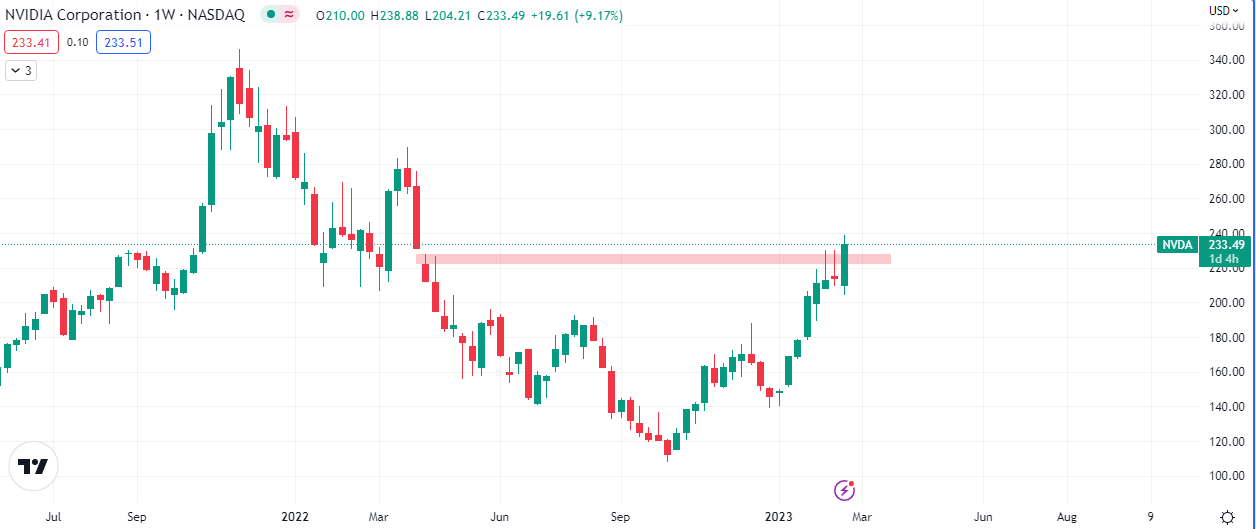
The Weekly chart has a slightly bearish potential due to the inability of price to breach $230 over the last 2 weeks. This current price surge may very well be the short liquidation that takes this stock back toward $180-$160.
Volume
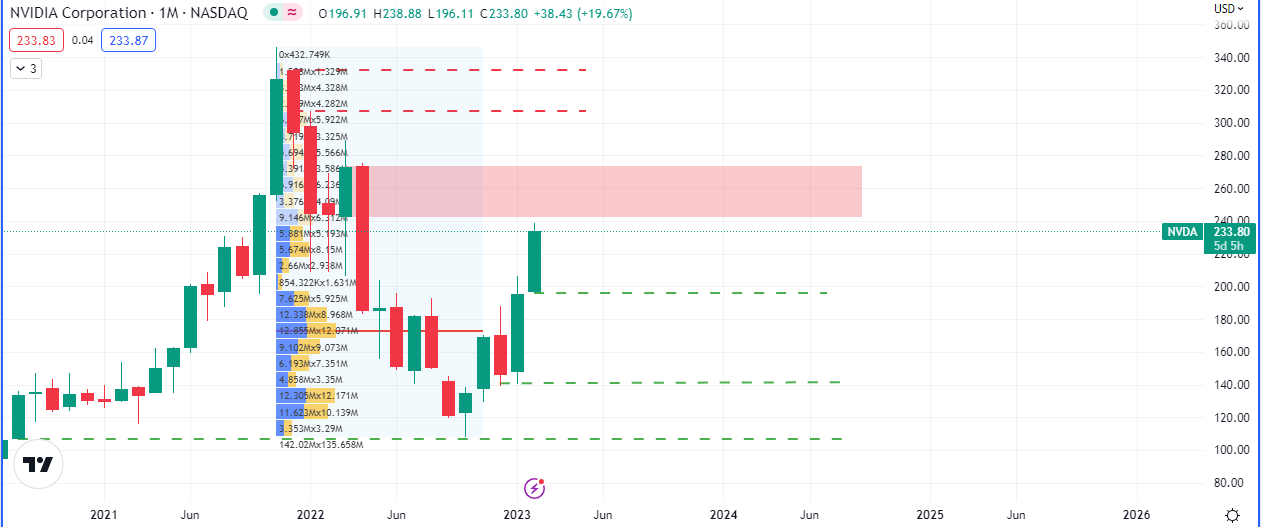
The volume profile suggests that we are trading above $180, the POC (Point of Control) or, for simplicity, the point in the consolidation with the highest volume. It is not unusual for price to gravitate toward areas with high volume, in this case, last month’s closing price.
Conclusion
There may be opportunities to buy at lower prices if the opportunity and broader macros align with the strong intrinsic values of NVDA. Our strategy is to watch what happens at $242.91 and then make a decision on whether to short or buy toward the next points of support and resistance highlighted above.
As we approach these important price points, it will be important to watch Interest rates, US dollar strength, volatility, the skew and the puts-call ratio.
Here is some of Nvidia’s bestselling products;
NVIDIA Jetson Nano Developer KitNVIDIA Jetson Nano Developer Kit“> (Computing performance for running modern AI workload)
Nvidia RTX 3090 TI Founders EditionNvidia RTX 3090 TI Founders Edition“>(A big ferocious GPU with TITAN class performance)
NVIDIA SHIELD Android TV Pro Streaming Media PlayerNVIDIA SHIELD Android TV Pro Streaming Media Player“> (Android streaming entertainment system)

Leave a Reply