
After a long time spent in doubt, it is becoming apparent to oil traders that OPEC+ is serious about keeping crude oil supply constrained.
Refinery disruptions in Russia resulting from Ukrainian drone attacks have also had a lot to do with the growing bullishness on oil markets, as the disruption of supply to the market from Moscow bites.
In the week ending March 19, traders bought the equivalent of 140 million barrels across the six most traded crude and fuel contracts. This was apparent in last week’s Friday’s close that presented a buy trade on Monday due to the fact that all the oil futures (Gasoline and crude) closed in the green, while WTI and BRENT stayed flat.
Working our way forward from 2022 to last week Friday, the screenshots below show periods in time (Weekly) where the oil benchmarks (WTI and BRENT) closed in opposite directions. In addition to this divergent close on the benchmarks, we watch S&P500, XLE (Energy Stocks Index) and VIX (volatility/fear index).
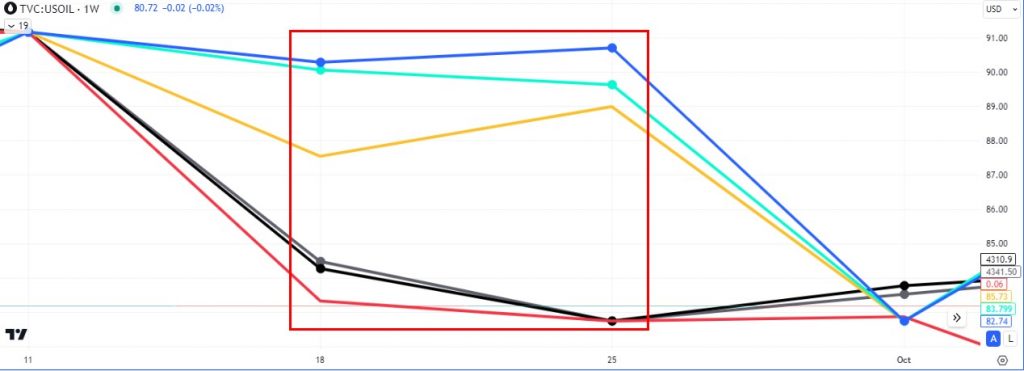
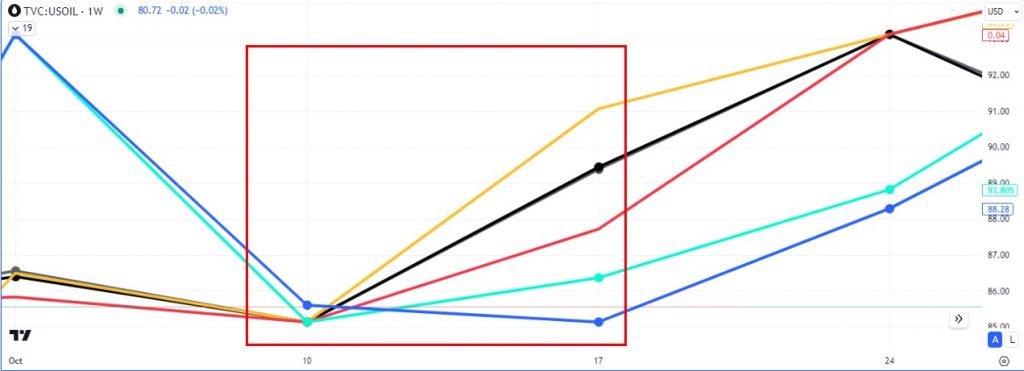
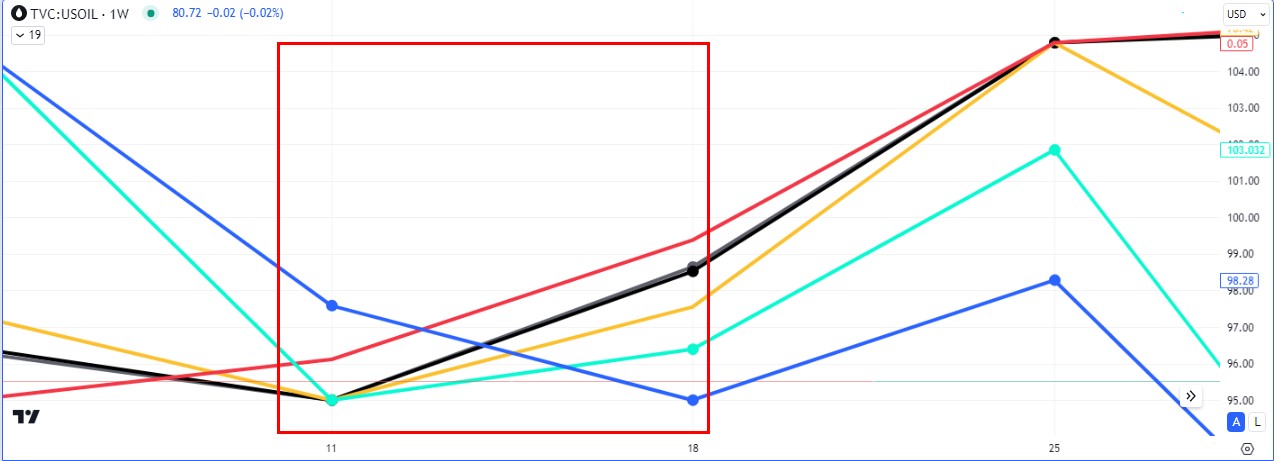
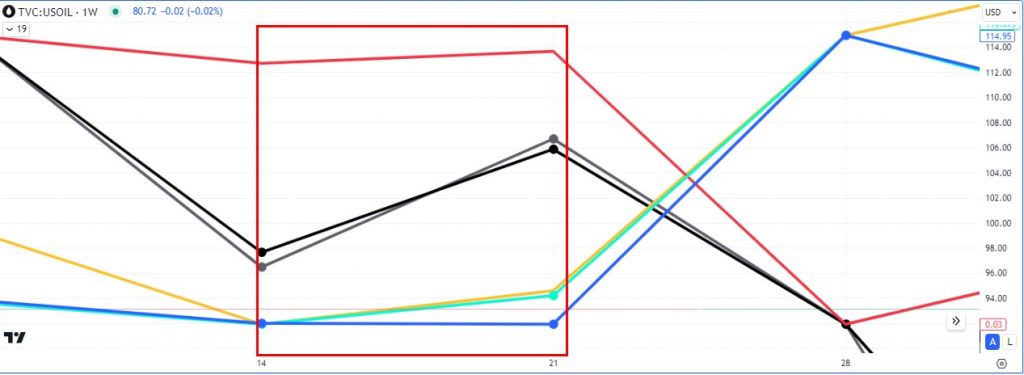
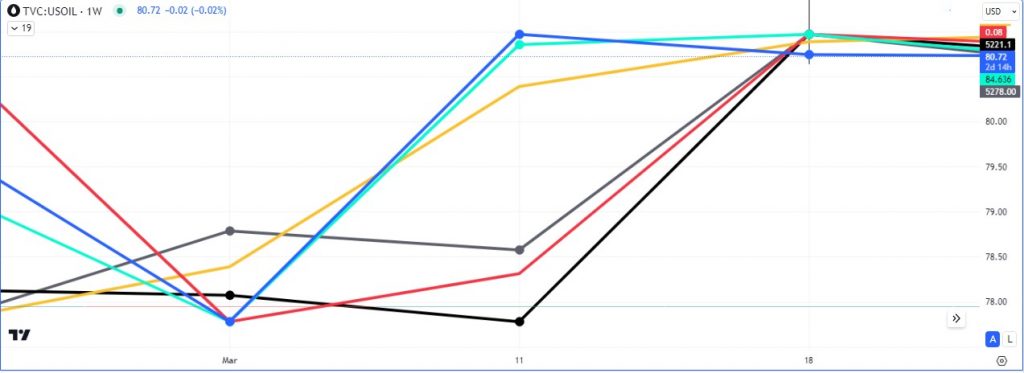
Last week’s close showed an uptick in risk metrics like the $S&P500 and it’s associated markets, while $WTI closed lower. One other component to note is the fact that $BRENT oil also closed higher.
These components are some of the data point to look at when trying to get a better view of where inflation is in the market.
The key, when it comes to the baskets in the charts above is to watch for a ‘lone ranger’ divergence on one of the benchmarks vs the rest of the basket and trade towards the majority.
The current short term probability, in terms of the laggard ($WTI), is a rally and increase in price this week as already seen from the buying seen in the futures market on Monday.
Turn on notifications for more interesting updates

Leave a Reply