
Bond traders and equity traders have a rather different view of German and European stocks, and this difference in opinion has persisted for a while and has developed into a potential ‘crash’ in European stocks, with targets at the middle of the spread implying a potential drop of 20%.
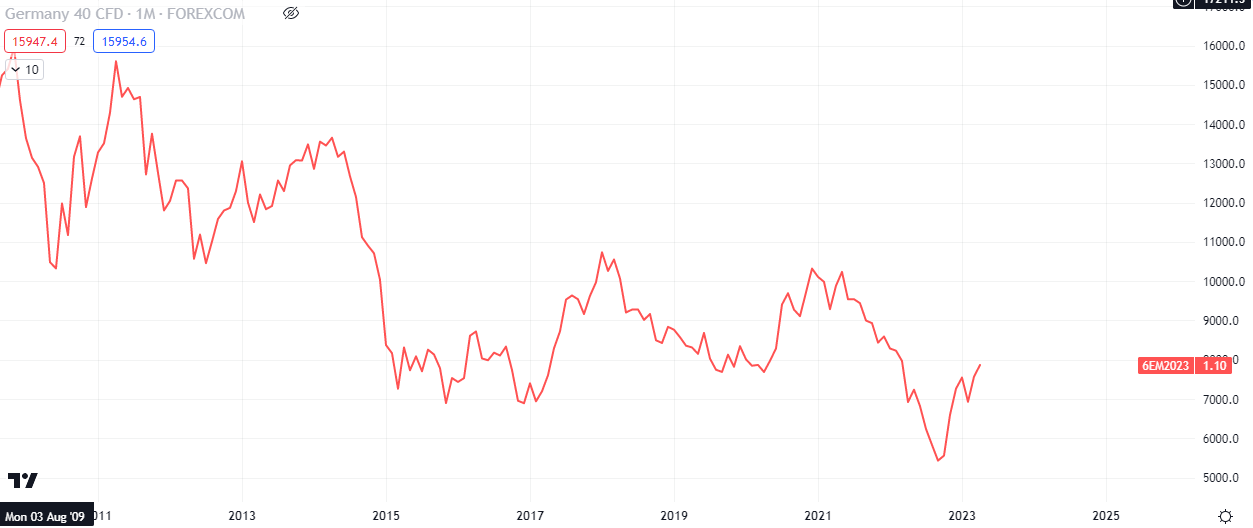
Since September 2022, the German DAX40, the German stock index, has been in an uptrend. This rally has been in tandem with a downtrend in the German Curve. The German curve is basically the difference in demand between the German 10Y treasury and the 02Y treasury.
Under normal circumstances the relationship between equities and bonds is a negative correlation, as investors usually rotate into stocks and out of longer duration government debt in times of dropping interest rates and ‘growth’. The opposite is the case in a environment with rising interest rates.
DE10Y-DE02Y is key because while demand on the 10Y reflects ‘growth’, investors usually rotate into the 2Y when inflation and central bank interest rate hikes are ramping up. Thus the shorter duration debt is a sort of risk off gauge to watch when trying to decipher when institutions are moving capital between stocks and bonds, due to sentiments associated with risk.
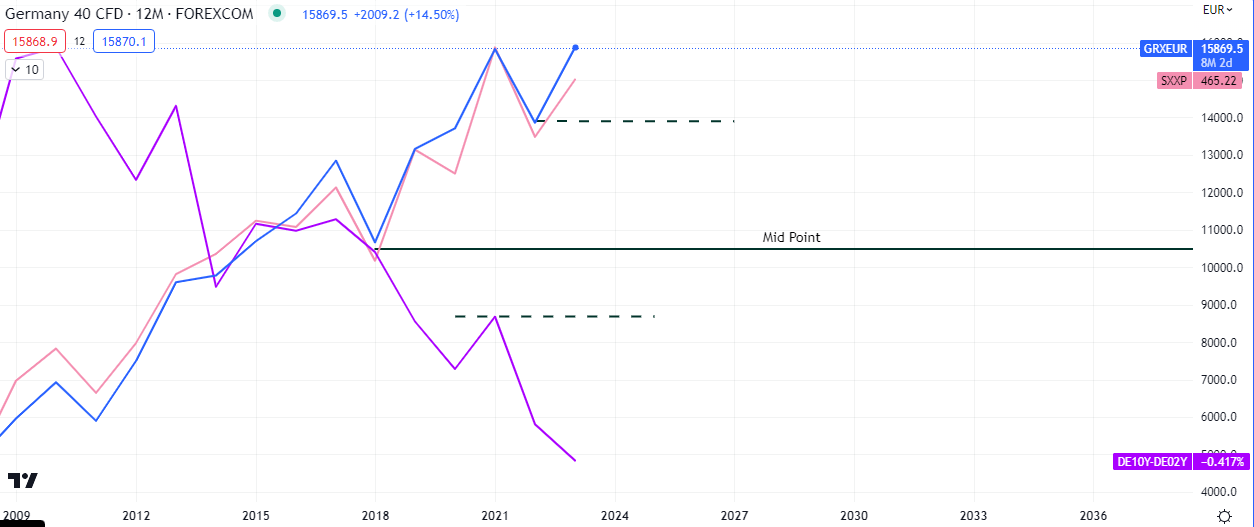
The shorting opportunity on the German DAX40 is two fold; The chart above shows the yearly chart showing that the spread from 2018 to date. It shows a midpoint just below 11000.0, which is an estimation of the area we can expect European equities to drop to, and the curve to rise to, a mean reversion/spread close.
Using the midpoint as the target for a potential position trade will not be accurate but it can be used as a reference point. From a yearly perspective, the lows of 2021 would be a more realistic target.
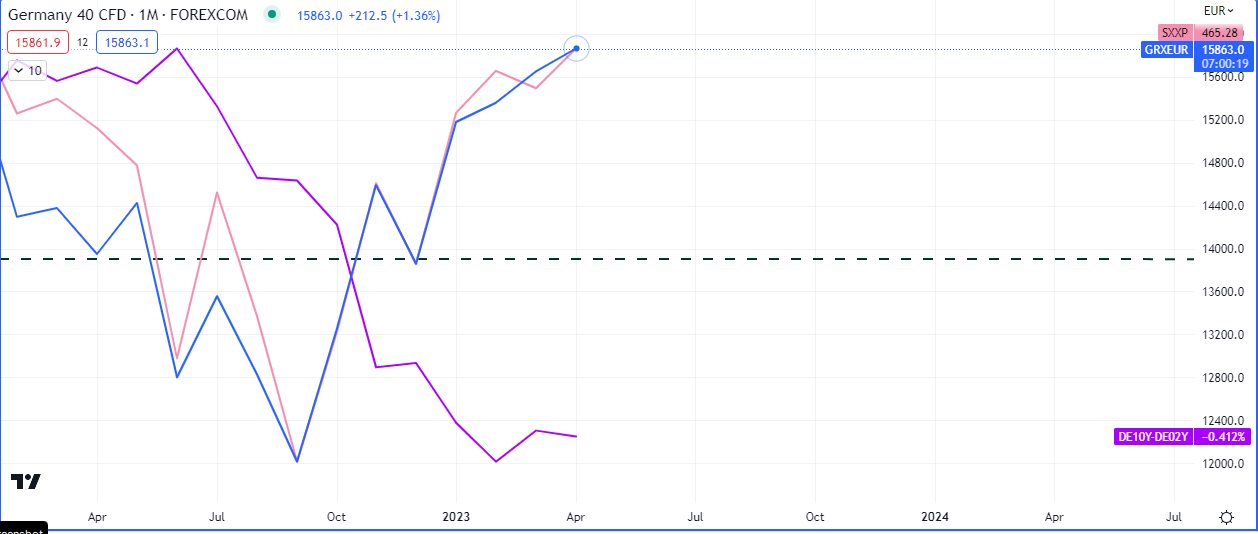
Taking a closer look, we see the said spread on the lower monthly timeframe that has evolved since late last year. Demand has come into the 2Y treasury more than the 10Y, yet stocks have continued higher with only minor pullbacks. The midpoint/target area for a markdown in this timeframe is at 14000.0. We can already see bit of a recovery on the 10Y in 2023.
Depending on volume and other values at the current highs, we can expect some selling pressure to come into the market as the spread is closed.
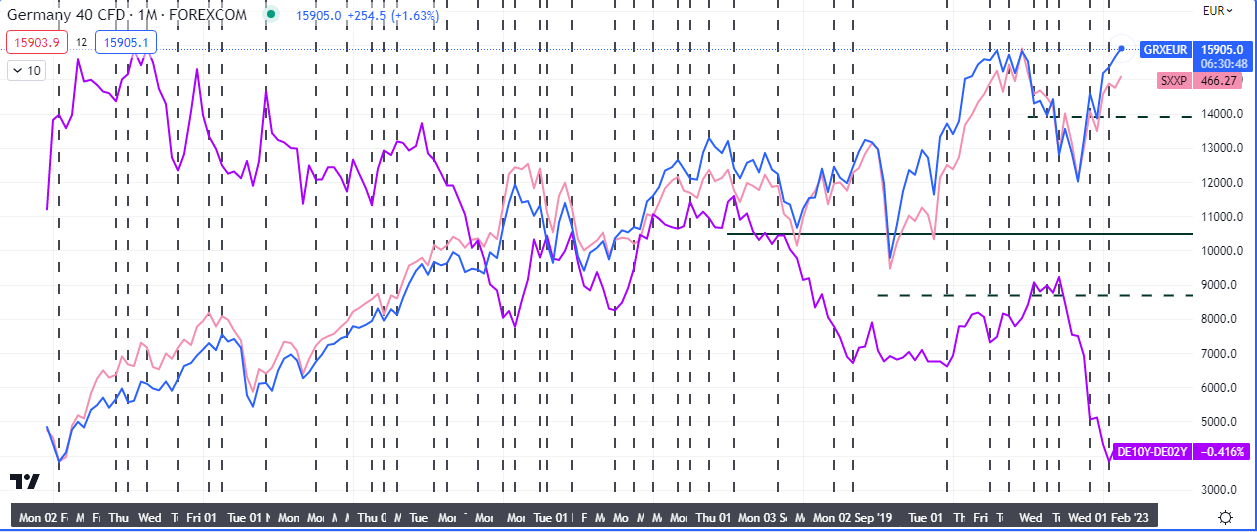
The black broken vertical lines in the chart above represent times when a spread evolved between the curve and equity prices. The reversion sometimes take a while, however each time the bond traders and equity traders have had differences in opinions, the bond traders have come out on top more than 90% of the time.
What has been the ECB being up to?
Last year the European Central Bank increased interest rate multiple times to tame raging inflation in the Euro area. This should have resulted in the strengthening of the Euro but it instead went on to test lows and went below parity with the US Dollar for the first time in years.
The Russia-Ukraine war and the weaning of Germany off Russian gas all added volatile variables into the equation.
The ECB will have its monetary policy meeting next week. Another rate hike is widely expected. Analysts at Danske Bank point out that the question is whether it will slow the hiking pace to 25 basis points or continue to hike once more by 50bp. They see a 50bp more likely, with no specific forward guidance but repeating a data-dependent approach to future policy decisions.
Due to the fact that rising interest rates strengthens the currency and weakens the equity markets, this recent recovery on the Euro, as depicted in the chart above, is significant.
If this strength persists, with the curve-equity spread in the mix, then we may see some major weakness coming into European stocks.
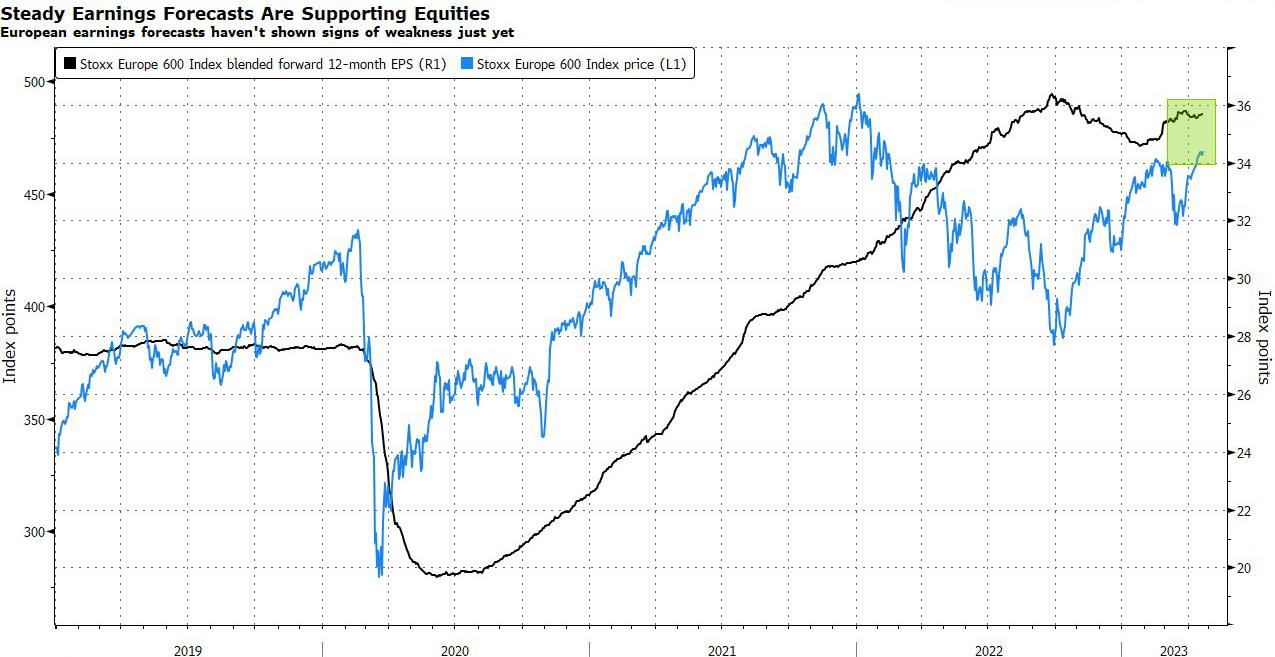
So far, earning season has been good for European stocks and this has propped up the market, along with other factors.
What to watch out for going into the rest of 2023
The catalysts to watch for in the narrative of a bearish European equity market are
- ECB Policy
- Geopolitical Events
- Energy Prices
- Earnings Reports
- Volume Exhaustions Above Balance Areas (4H, Daily and Weekly Timeframes)
By patiently watching the data points above, opportunities to short the German DAX40 and STOXX600 may be found.
Some of the companies that make up the DAX include:
- Airbus SE (AIR:GR)*
- Adidas AG (ADS:GR)
- Allianz SE (ALV:GR)
- BASF SE (BAS:GR)
- Bayer AG (BAYN:GR)
- Beiersdorf AG (BEI:GR)
- Bayerische Motoren Werke AG (BMW:GR)
- Brenntag SE (BNR:GR)*
- Continental AG (CON:GR)
- Covestro AG (1COV:GR)
- Daimler AG (DAI:GR)
- Delivery Hero SE (DHER:GE)
- Deutsche Boerse AG (DB1:GR)
- Deutsche Bank AG (DBK:GR)
- Deutsche Post AG (DPW:GR)
- Deutsche Telekom AG (DTE:GR)
- E.ON SE (EOAN:GR)
- Fresenius Medical Care AG & Co. KGaA (FME.GR)
- Fresenius SE & Co. KGaA (FRE:GR)
- HeidelbergCement AG (HEI:GR)
- HelloFresh SE (HFG:GR)*
- Henkel AG & Co. KGaA (HEN3:GR)
- Infineon Technologies AG (IFX:GR)
- Linde PLC (LIN:GR)
- Merck KGaA (MRK:GR)
- MTU Aero Engines AG (MTX:GR)
- Muenchener Rueckversicherungs-Gesellschaft AG in Muenchen (MUV2:GR)
- Porsche Automobil Holding (PAH3:GR)*
- Puma SE (PUM:GR)*
- Qiagen N.V. (QIA:GR)*
- RWE AG (RWE:GR)
- SAP SE (SAP:GR)
- Sartorius AG Vz (SRT3:GR)*
- Siemens AG (SIE:GR)
- Siemens Energy AG (ENR:GR)
- Siemens Healthineers AG (SHL:GR)*
- Symrise AG (SY1:GR)*
- Vonovia SE (VNA:GR)
- Volkswagen AG (VOW3:GR)
- Zalando SE (ZAL:GR)*
Past results do not imply future result. It is important to remember that investors can lose more than they invest in the capital markets. The information contained in this article are for educational purposes and should not be taken as investment advice. Do your own research to confirm or discredit any of the ideas in this article.


 Premier League