
$TSLA beat it’s last earnings estimate of 0.846 with a surprise of 0.48%, but missed it’s revenue estimate of $23.956 billion, posting a surprise of -$266.966 million (1.13%).
With it’s next earnings release coming up in June, the share price of the EV maker is being watched closely by investors as the quarter evolves, especially with the expectations of an incoming recession.
The share price recovered 68.42% in the first quarter of 2023 and subsequently pulled back 22% in April, however the short term chart looks rather bullish but with overhanging resistance not too far off.
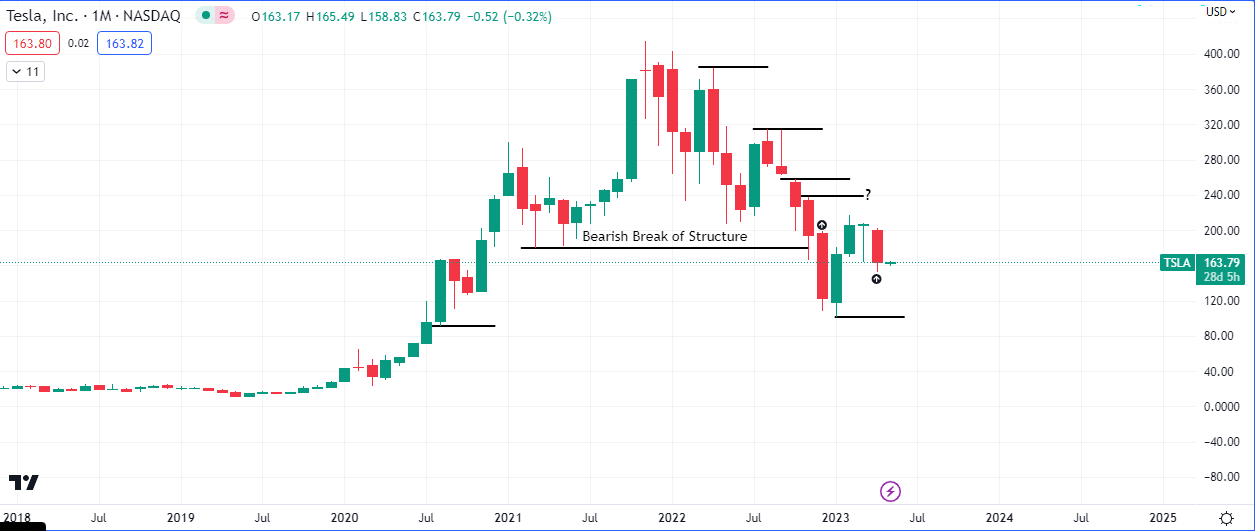
The share price broke down below a key level in late 2022 and also managed to close below it. Price rallied this year and managed to close back above the candle that broke structure to the downside, rendering the year’s price action as support
However, there are also price levels that have a lot of bearish liquidity (stop losses), that are likely going to be raided. $237.40, $257.50, $314.67 and even $384.29 are all susceptible to reversals back down to $95. These reversals may be especially volatile given the overall bearish break of structure highlighted in the chart above.
The low of $152.37 set in April should act as support to the first checkpoint at $237.40, if this month closes above $163.17.

Leave a Reply