
How do US treasury auctions work and why is it important to understand them as a trader?
According to information on the US Treasury’s homepage, the auction process can be broken down into 4 parts.
- Announcement of the auction
- Auction is held
- You bid for the amount you want
- The security is issued
Announcement of the auction
- What securities they are auctioning
- The amount they are offering
- Auction date
- Issue date
- Maturity date
- Terms and conditions of the offering
- Closing times for non-competitive and competitive bidding
- Other relevant information
To know when an auction will take place, you can:
- Sign up on tresurydirect.gov to get auction announcements
- See a list of upcoming auction announcements
(Updated every Friday by 10:45 AM, Eastern U.S. time) - Look in newspapers that include their announcements
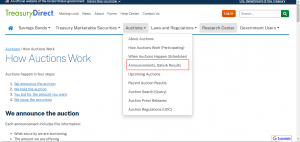
- Check their page for when auctions happen
Four times a year, the Department of the Treasury holds a press conference to discuss Treasury marketable security auctions. This usually happens on the first Wednesday in February, May, August, and November. At each of these press conferences, tentative auction schedules for the next six months are given.
TOP 100 Dividend STOCKS To Consider In 2023
During a press conference, Treasury may also announce other decisions relating to the auction schedule or Treasury marketable securities in general. The Treasury Department’s website has information on the quarterly press.
Governments regularly borrow money to fund their operations and to do this, they issue ‘debt’ called treasuries. The global bond market is worth about $120 trillion worldwide and $46 trillion in the US, according to Securities Industry and Financial Markets Association (SIFMA). This market dwarfs all other markets; it is, therefore, important to understand some of its inner workings because it affects all other markets.
Understanding the outcomes of US treasury auctions helps us as traders, retail or institutional, gauge risk on-risk off, gauge an outlook for interest rates and it helps us find trades in bonds and currency markets. It is a known fact that currencies trade toward treasury yields so forex traders can add this to their arsenal.
It is important to note that the Federal Reserve and the US Treasury are separate organizations although they work in concert on certain issues. Many people think that the Federal Reserve (a private group) issues treasury bonds but that is actually not true! The US Treasury (a government entity) is the sole issuer of treasury bonds.
The US Treasury may be funding a new debt or a refunding of previous debt. Many of the participants in these auctions are members of competing central banks like the ECB, PBC and BOJ. To utilize this information as a trader, you do not need to know whether it is a new supply or a resupply, focus should be on the numbers the auction traded at. These auctions are called ‘Dutch’ auctions because participants do not know details of the bids coming in until the bidding process is completed, unlike regular auctions.
How an auction work
Terminologies
- When Issued (WI): A conditional contract that allows bidders see how much demand is on the auction one minute before it begins. It is the interest rate the Treasury thinks is being forecasted and it is a sort of benchmark for how much interest they are willing to pay on the bonds.
- High Yield (HY): This is the lowest offered interest for the bond
- Basis Point: Interest rates rise per basis point. 1% = 100bp
- Tailed Auction or Stop Through (The difference between the HY and WI)
- Bid to Cover Ratio (B/C): The number of bids it takes to cover/raise the entire debt/bond the treasury needs OR Total Value of Bids/Total Value of Bonds
Let us assume the US treasury wants to issue a new bond of $100 million with a WI of 0.75%
| $100M |
| BIDS |
| 2% – $100M |
| 1.5%- $100M |
| 1.0% -$100M |
| 0.5% – $100M |
WI =0.75%
STOPTHROUGH = 25bp
B/C = 4:1 (Good Auction)
HY = 0.5%
HY<WI (This was a good auction for the US Treasury)
In the mockup above there are 4 bidders. The first bidder offers the full $100 million and asks to be paid back with an interest of 2%. The other bidders below also put their offers into their envelopes and pass it forward discreetly. One must recall that the US Treasury is looking for the best deal for themselves; that is the cheapest debt possible because they’ll be able to finance their debt at the lowest rate possible. Therefore the most attractive bid in the mockup above is the bid for 0.5% interest, making it the High Yield (HY) because it was the highest yield that was accepted by the treasury department. Once the High Yield is ‘locked in’ this is the interest that will be paid on maturity of the bond once the coupon is issued, be it 2Y, 5Y, 10Y or 30Y.
The High Yield is lower than the When Issued in this auction thus there was a good demand. Bonds should RALLY after this auction due to the high demand and the drop in the yield. Keep in mind that Yields and Bond prices have a negative (inverse) correlation.
Also note that there was a 25bp (Basis Point) stop through in the auction. We calculate this by subtracting the High Yield from the When Issued;
HY-WI: 0.75 – 0.5 = 0.25
We had a 25% ‘Stop-Through’. The Bid to Cover Ratio is 4:1 because there are $400 million dollars-worth of bids for $100 million dollars-worth of bonds.
Some of the knock-on effects of this demand for bonds will include; dropping interest rates, bad data, elevated risk (risk off). In the case of elevated risk, there may be higher risk in the markets so investors are willing to accept poor interest rates for the ‘safety’ of bonds. When we see a lot of demand coming into the 3Y treasury bills for example we can assume it may be a flight to safety by the large institutions in a risk off environment.
The example above is rather extreme as it usually takes multiple fractional bids combined to raise the full issue.
| $100M |
| BIDS |
| 2% – $20,000,000 |
| 1.5% – $30,000,000 |
| 1.0% – $30,000,000 |
| 0.5% – $20,000,000 |
WI = 0.75%
Tailing Auction: 125bp
HY>WI (Poor Demand). Every bidder in this auction gets 2%
B/C: 1:1 (Weak B/C = Weak Auction)
In a fractionalized auction the bid with the highest interest offer gets the high yield and every other bid gets the high yield regardless of what they bid, as long as the full issue has been raised. This is done to encourage competitiveness among bidders in the auctions. Imagine if you were a bidder and you had offered 0.5% but still ended getting 2%, you would probably be smiling to the bank. Remember; anyone can bid at these auctions so long as they have the capacity to do so.
Bidders enter these Dutch auctions either as ‘competitive’ bidders or as ‘non-competitive’ bidders. Non-competitive bidders take whatever the high yield is while competitive bidders try to push the envelope and raise the bids to their liking and they are a big part of the process.
The bid to cover ratio in this more practical example is 1:1 because there is $100 million worth of bids for $100 million dollars-worth of bonds.
In this case, due to the poor demand we expect a drop in the price of Bonds.
HY-WI: 0.75 -2 = -1.25
Hence we had a tailing auction of 125bp, which was a pretty poor auction.
There is another scenario where after all the bid envelopes have been opened and the bond issue has not been fully raised, that is, the number of bids are not up to the amount the US Treasury is trying to raise.
| $100M |
| BIDS |
| 2% – $15,000,000 |
| 1.5% – $30,000,000 |
| 1.0% – $12,000,000 |
| 0.5% – $10,000,000 |
In this case, the Treasury is looking to raise $100 million but the bids, after being counted, amounted to only $67 million. There is basically no ‘demand’ for this bond, but there is a process in place that solves this problem.
There is a group called the ‘Primary Dealers’. These dealers have to take up the remainder of the issue at the high yield. These primary dealers, big banks like Band of America, JP Morgan, Goldman Sachs and the like, step into the auction and they are obliged, by law, to pick up the remainder of the issue. In this case, they would have to take up the remaining $33 million of bonds at the high yield, which is 2% in this case, just like every other bidder in this auction. These dealers have ‘perks’ and preferential access to the US Treasury for being primary dealers, so it is not pro bono.
After the auctions are finished, the results are posted on the US Treasury’s website, treasurydirect.gov, where you can access it. Find the navigation route to recent auction results below.
Click on “Announcements, Data and Results”.
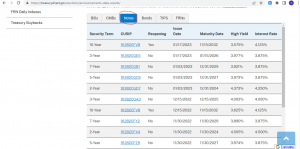
It is worth mentioning that bonds with durations of 4 weeks to 26 weeks are called treasury bills, bonds with durations between 2 years to 10 years are called treasury notes and the 20 year and 30 year bonds are called bonds. The table above shows some of the data associated with the most recent auctions. For a more detailed view, for information we can use in our trading we need to navigate to another part of the website.
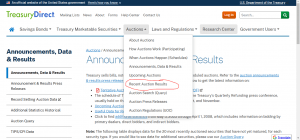
Click on “Recent Auction Results”
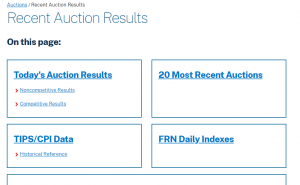
Click on either “Competitive Results” under “Today’s Auction Results or click on “20 Most Recent Auctions”
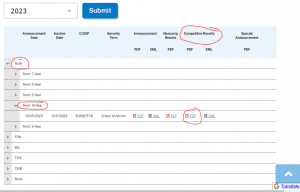
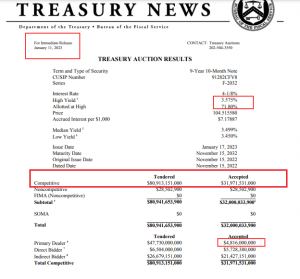
In this example, we chose Notes-10Y-Competitive Result (PDF). The auction results we will compare are the 9-Year 10-Month Note of December 12, 2022, and the 9-Year 11-Month Note of January 11, 2023.
TOP 100 Dividend STOCKS To Consider In 2023
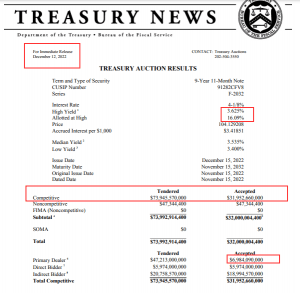
The key data points highlighted are the High Yield, Allotted at High, Competitive bids accepted and the bids accepted from the primary dealers.
We need to pay particular attention to the primary dealer numbers and the bid to cover as it gives us an indication of demand for the treasury. The movement of the yield itself, while being important overall, is not as important as the b/c and primary dealer numbers in the most recent auction.
The High Yield for December is lower than the When Issued. 43.2% of the competitive bids tendered were accepted in total and only 14.7% of the bids tendered by the primary dealers were accepted accounting for 21.8% of the accepted bids. There was a Bid to Cover Ratio of 2.31. In January the High Yield is also lower than the When Issued. The Bid to Cover was 2.5 and the primary dealers had 10.1% of their bids accepted accounting for 15% of the accounted bids. What we can glean from this is that the Bid to Cover Ratio increased and the primary dealers picked up less of the debt when we compare December’s auction result to January’s.
If you trade bonds then looking for possible buy opportunities in 10Y notes could be in your plans. If you trade forex then the uptick in demand for 10Y notes could alert you to a possible risk off sentiment in the markets so you can look for possible short positions in equities and some currencies such as the Australian Dollar and the Canadian Dollar. If you notice a massive demand on 2Y auctions, for example, you may investigate further to see if the demand for short-term government debt is tied risk issues in the market and you then trade accordingly.

Leave a Reply