
The S&P500 ($SPX) has continued the recovery that started in earnest in October. A slow down in inflation, among other factors spurred the rally that slowed down in December but continued in January and early February. In this article we take a look at the ‘bare-bones’ charts, to see what price action occurred and what price action we can expect in the coming days.
The way price rallied in October and November 2022 reminds me of an attempt at a buzzer beater in a game of basketball. It was good news for the bulls that November was able to close above the high of October, but the key resistance at August and September’s highs are the main hurdles to scale for a challenge of 4500 and possibly the all time high.
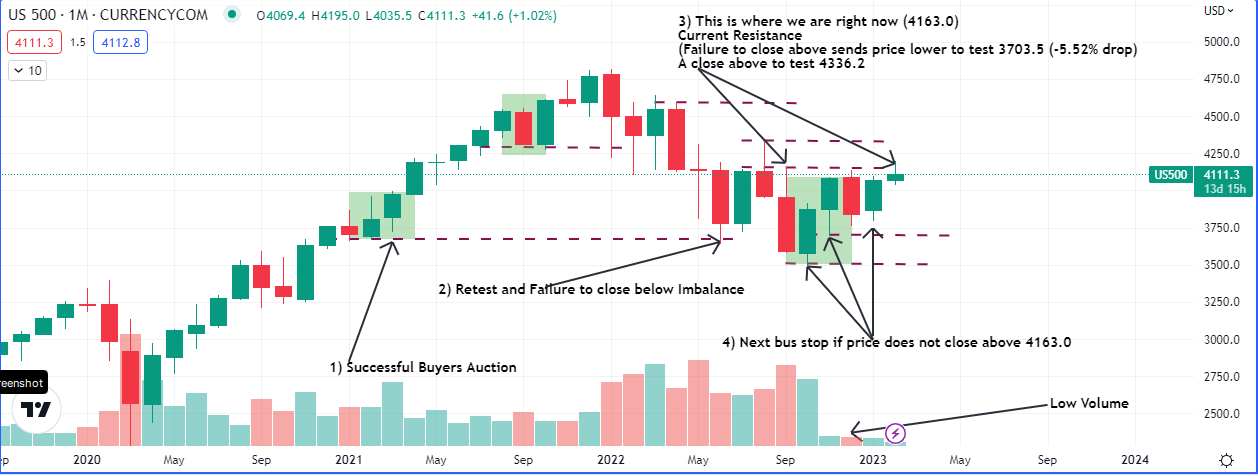
June 2022’s low retested and failed to close below February 2021’s low. February 2021’s low is the bottom of an area of imbalance (clean higher highs on increasing volume) set up in February, March and April 2021. Hence the failure to close below it June 2022 was a sign of support, all other macro factors being equal. However price ran up into the resistances of August and September 2022 and was knocked back and closed below the low of June and July 2022.
The key battle now is between the candle of August and September ’22(bearish) and October, November and January ’22 (bullish). How price breaks the lows and the highs of these months will determine the fate of the S&P500($SPX) for the next few months.
This is an area of congestion but given the way things are set up, we can expect price to at least test 4332.3 (August 2022’s high). The way this month closes will determine lot.
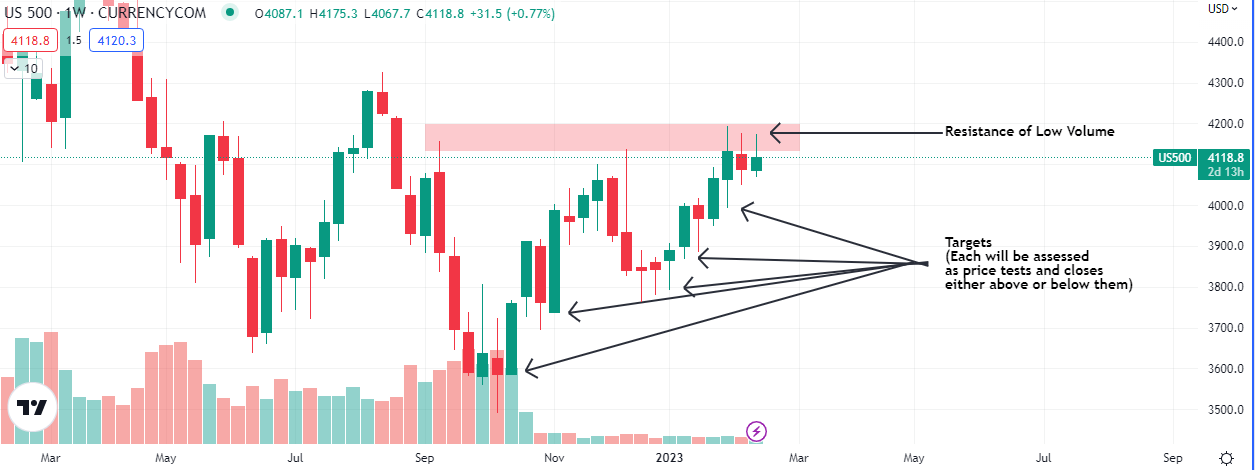
On the weekly timeframe price seems poised to drop this week or next week. The checkpoints for this drop can restart the rally but we will have to wait to see how price closes at those points. Intraday price, volume and macro investigations that align with this narrative may yield some fruit short term, although the monthly still seems poised to test the high of August ’22.
Macros to watch include the following
- Interest Rates and Inflation
- Puts-Calls Ratios
- Risk on Risk off
- Bond Yields
- VIX (Volatility)
- Skew
As the price action evolves we should keep an eye on these data points to make sure they are inline with our narratives and our trading and investment plans.

Leave a Reply