
Some of today’s top volume gaining stocks have chugged along as the trading week churns on. The US Dollar has continued it’s recovery after recording it’s biggest loss in nearly 9 months, last week. With the Fed Funds Rate and FOMC minutes coming up on Wednesday, some more volatility may come into the markets as investors price in the, the now dovish looking, Fed’s decisions.
So far this week the $DJI has led the equity markets higher as the so-called ‘AI fueled’ rally continued to slow down, and investors took on exposure in other sectors.
Here is a look at some of the highest volume gainers on the US exchange today
$AMC
$AMC stock closed up a staggering 33% today on several pressing news items, including impressive numbers from one of Hollywood’s latest big releases: Barbie. It is the current top volume gainer with over 256 million in market cap added.
Over this past weekend, AMC enjoyed its strongest weekend opening since 2019. The movie theater company held inaugural showings of both Barbie and Oppenheimer, bringing in more than 7.8 million viewers across domestic and global showtimes, between Thursday and Sunday. In the U.S. the theater chain even set a new post-reopening single-day attendance record on Saturday. Perhaps unsurprisingly, AMC also revealed it recorded its second-highest food and beverage sales ever in the U.S.
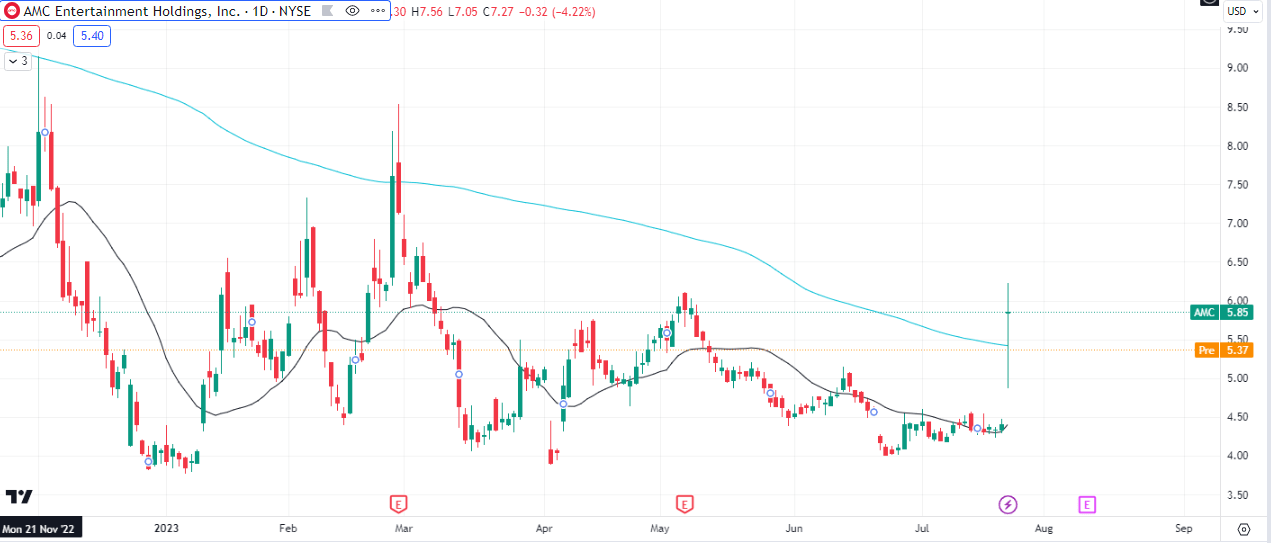
$AMC gapped up massively on the daily timeframe and it is currently trading above its 20 and 200 simple moving averages. It is too early to assume a trend change but the gap will likely fill and the extension of price away from the 20SMA should add to the downward pull or consolidation.
$AMC’s earnings (EST -0.04) and revenue ($1.272B) report is due on the 10th of August, 2023.
$TSLA
The EV manufacturer had a pretty good earnings report surprise with an earnings surprise of 14.78% and revenue surprise of 2.91% ($705.823M)
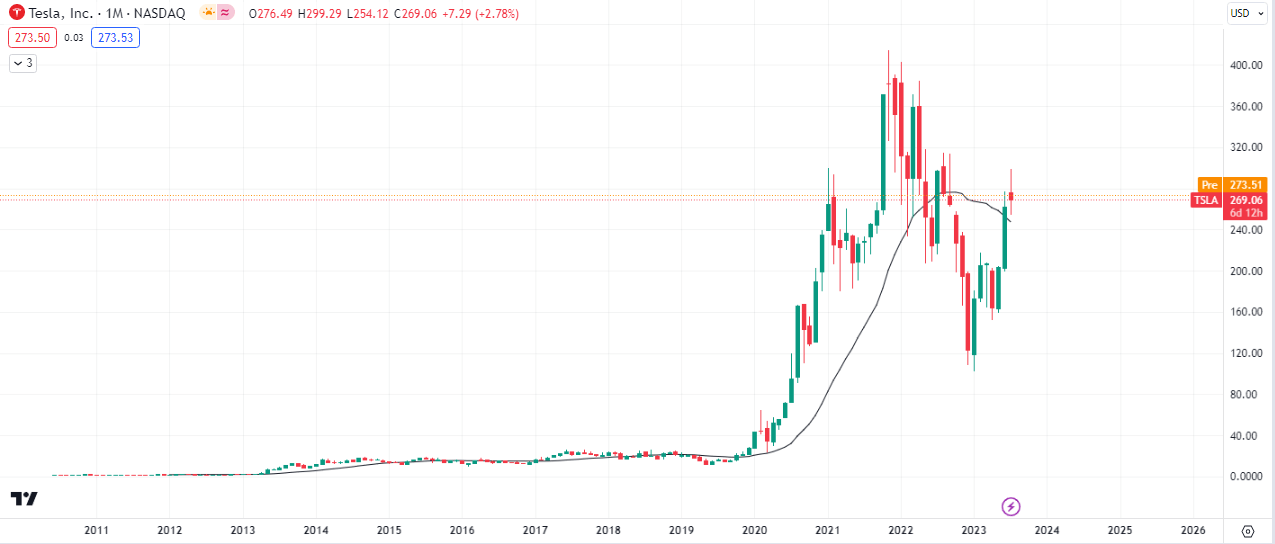
The most intresting thing about the $TSLA chart is the looming break of structure that still has a chance of dropping price to $80, with $315 being the next likely resistance to be tested.
$NIO
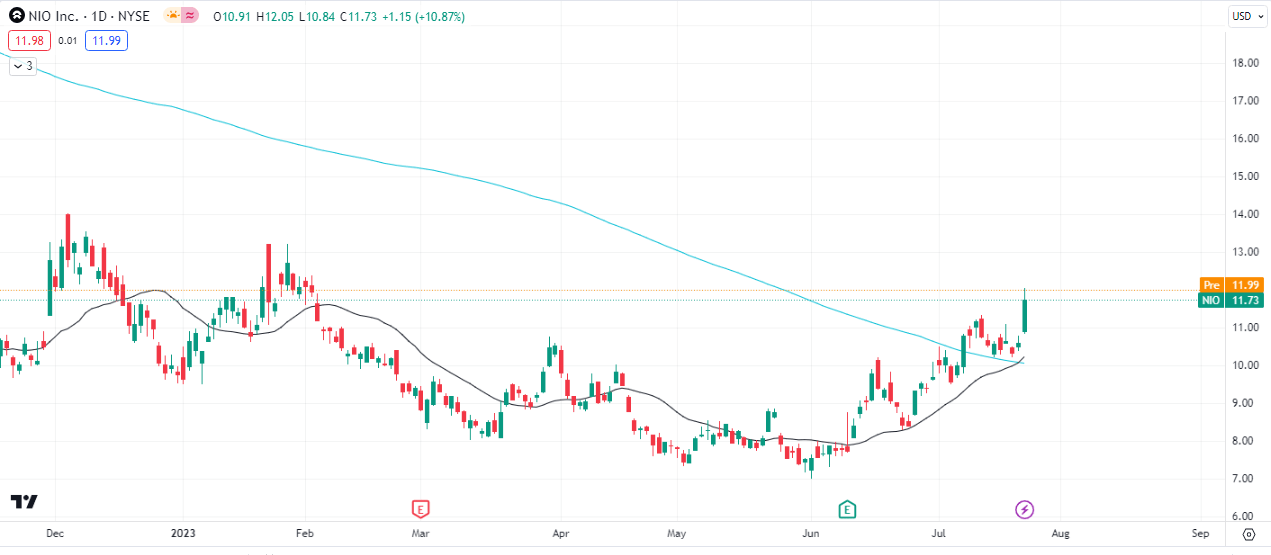
$NIO is currently trading above it’s 20 and 200 simple moving averages. Yesterday’s bullish wide range bar gapped up close to the 20 and 200 SMAs, giving rise to the probability of a price continuation.
The earnings report on this stock is due out in September.
$NVDA
Our price target for $NVDA is still $580, as stated here in February, however some key factors must be noted about the counter (bearish) possible narrative.
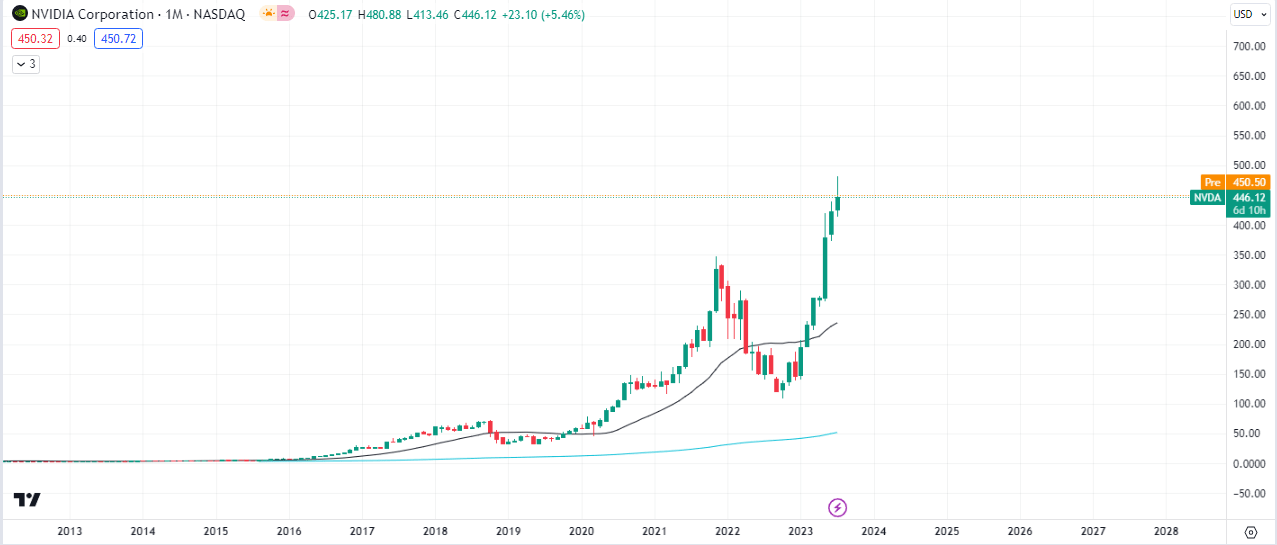
The tech giant is bullish with 7 consecutive bullish months! However it is highly extended from it’s 20 and 200 simple moving averages. These prices bases of some of these demand levels can act as support in the event of a deep or shallow pullback.
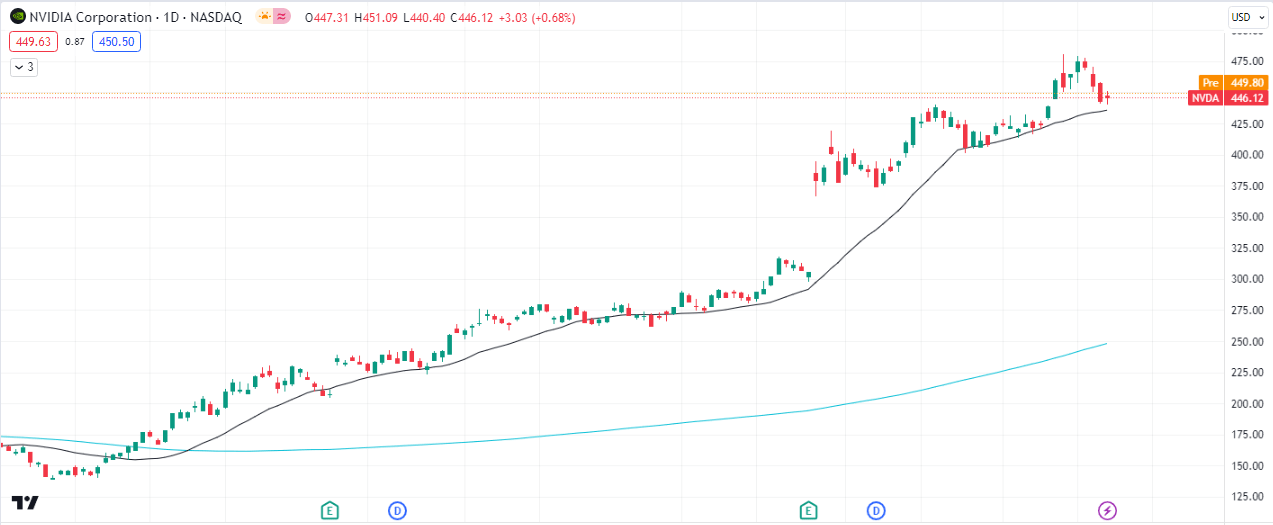
The daily chart shows price still trading above its 20 and 200 SMAs.
$PLTR
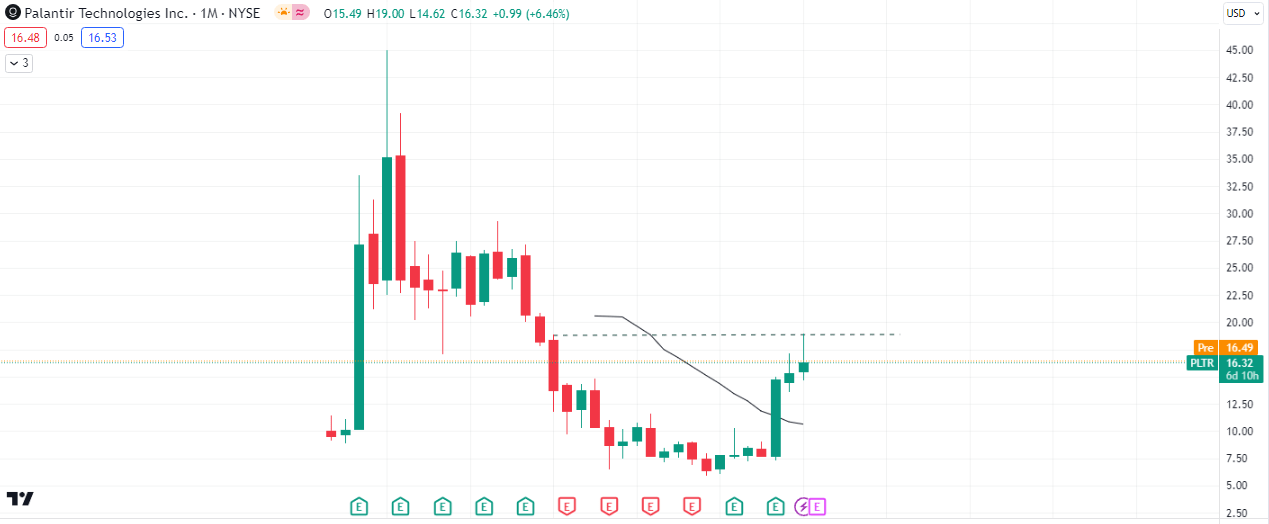
With it’s earnings report due in August, $PLTR is in the crosshairs as it is seen struggling to break above the high of 2022. If the month closes below the high of 2022, $18.84, then some downside may ensue, although the 20MA may have a buoyant effect on price.
$GOOGL
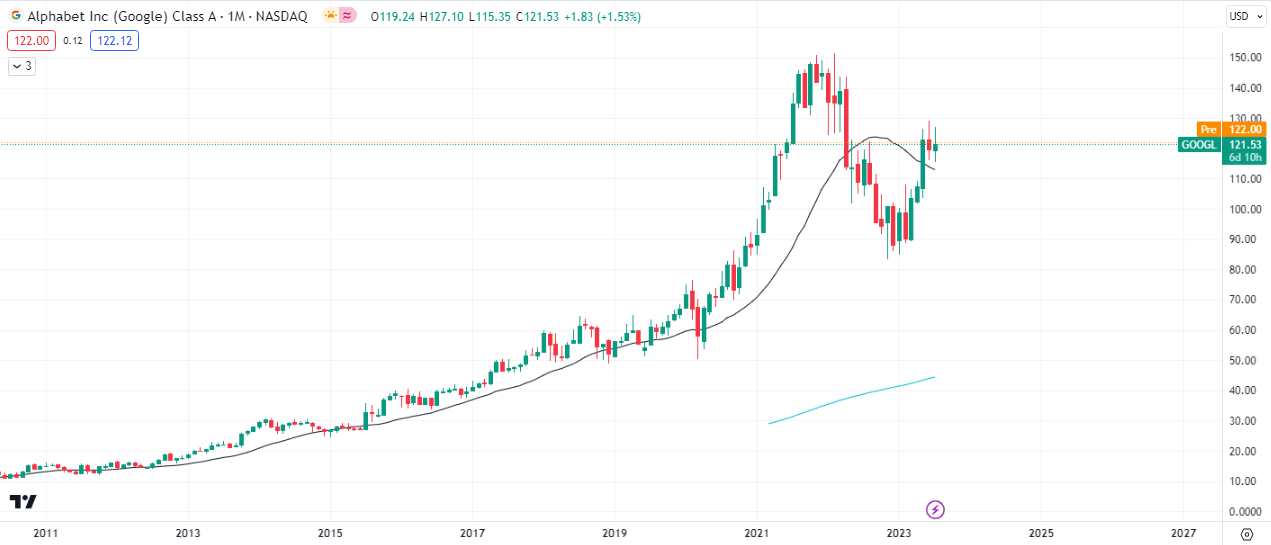
One key take way from the $GOOGL chart above is that it is now trading above it’s 20SMA for the first time since April 2023.

Leave a Reply