

The ‘Tech Rally’ stalled again today as the Nasdaq ($NDAQ) continued lower today where it left off from last week, after failing to close above a key resistance set in 2022. Although price can be held and pushed up from numerous support levels below, there is a chance for a deep pullback if the key supports fail.
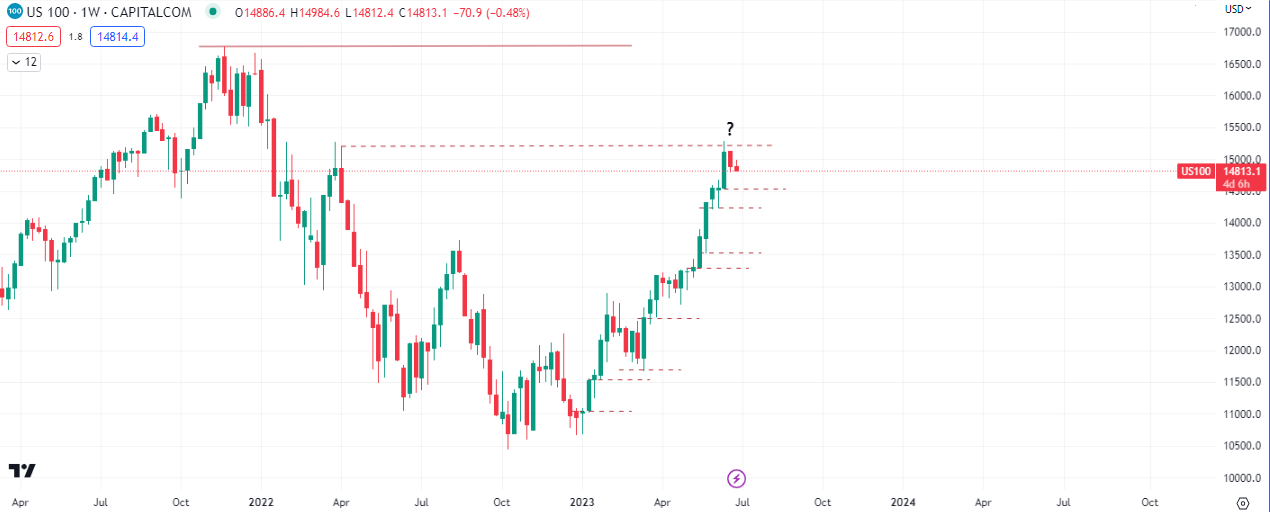
U.S. stocks edged lower on Monday, with technology and megacap stocks leading declines as investors worried about the impact of further interest rate hikes on the economy.
The main indexes pulled back at key resistances established in 2022, two weeks ago, continued lower last week and we saw more of the same in the first day of trading this week, after Fed Chair Jerome Powell signaled more interest rate hikes ahead.
“The Fed has talked about raising rates in a very choreographed message. So consensus has another rate hike in July, but remember that meetings not till July 26th and we’ve got a lot of runway in front of us that could change that view,” said Art Hogan, chief market strategist at B Riley Wealth.
Markets also reacted to the aborted revolt by Russian mercenaries over the weekend that raised questions about President Vladimir Putin’s future and concerns about a possible disruption of Russian oil supply.
Advancing issues outnumbered decliners by a 2.48-to-1 ratio on the NYSE and 1.06-to-1 ratio on the Nasdaq.
The S&P index recorded 17 new 52-week highs and two new lows, while the Nasdaq recorded 42 new highs and 116 new lows.
Other metrics to watch
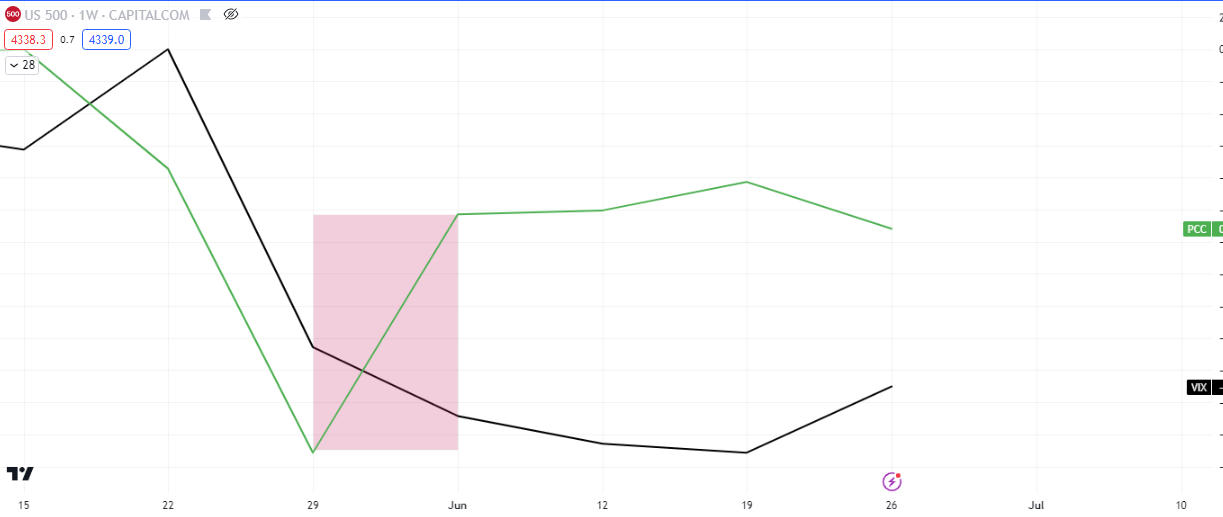
The Puts-Calls Ratio spiked last week, the continuation of that or the total retracement will have an inverse effect on equities.
The volatility index ($VIX) is also trading at lows set during the 2020 pandemic, hence we see this rather oversold and the probability of a spike increases as we approach the end of the month.
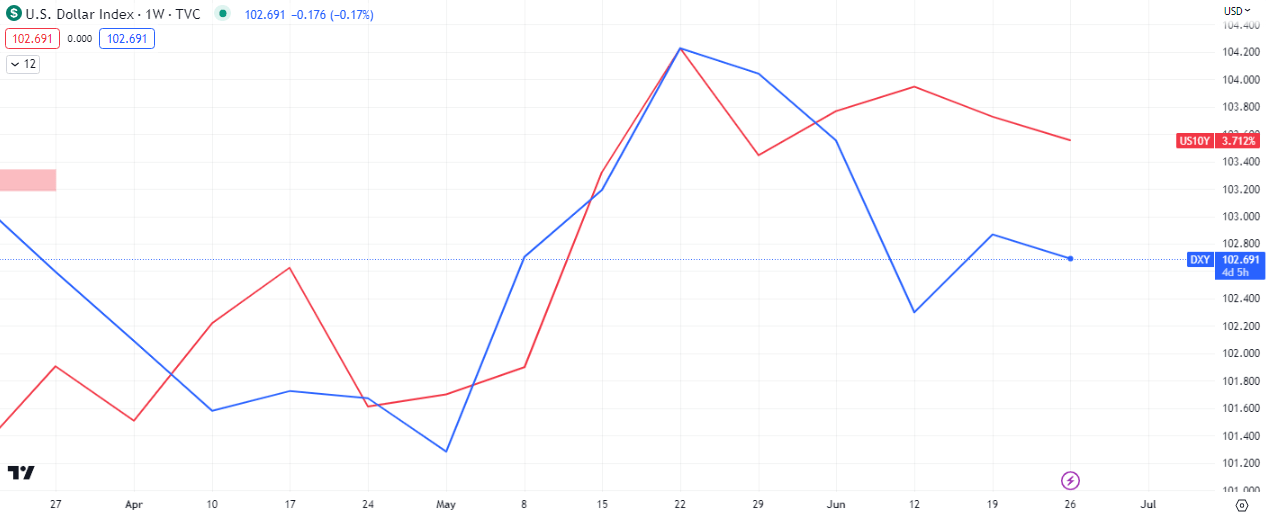
Last week a spread between the US 10 year treasury (US10Y) and the US dollar index ($DXY) occurred at the close. Some of it has started the mean reversion but there is still some way to go, especially if we see a continuation in the uptick on the US treasuries. This would be negative for equities, depending on what part of the economic cycle we are in.


Leave a Reply