
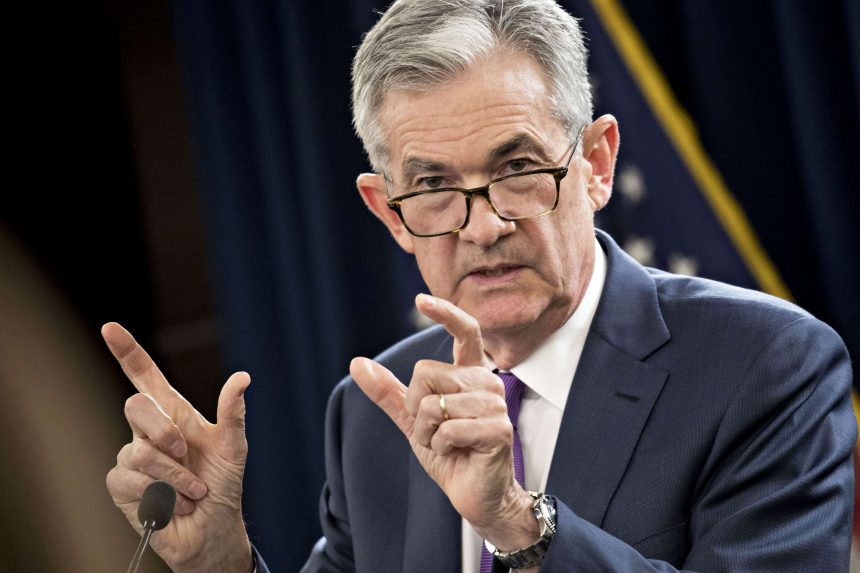
At the FOMC meeting today, the Federal Reserve, led by Jerome Powel, left the interest rate at 5.25%, as forecasted by the consensus and the Dot Plot.
The week has seen the US dollar trade downwards, through Tuesday and Wednesday, as the market anticipated the CPI on Tuesday and the FOMC today.
Powell sounded hawkish in his stance on policy, reiterating that inflation targets have not been met yet and more tightening is coming up.
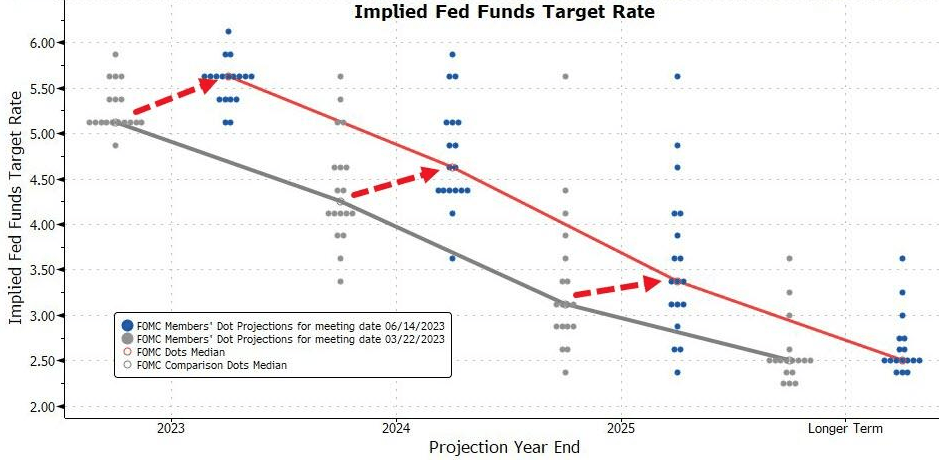
“It will be appropriate to cut rates at such time as inflation is coming down really significantly. And we’re talking about a couple of years out.“
“I think, as anyone can see, not a single person on the committee wrote down a rate cut this year — nor do I think it is at all likely to be appropriate if you think about it.”
“Inflation has not really moved down. It has not reacted much to our existing rate hikes. We’re going to have to keep at it.”
He could not have made the hawkish tone any more clearer.
The US Dollar Index ($DXY closed lower -0.29%, the Volatility Index ($VIX) closed lower -0.14% and the $SPX closed higher +0.13%. The $NDAQ climbed +0.83% while the $DOW diverged, closing lower by -0.71%.
Bond traders are rushing out bets that the Federal Reserve will lower interest rates this year after the central bank held its key rates steady and signaled more monetary tightening would likely be necessary to cool inflation.
Rates on swap contracts referencing future Fed policy meetings reflect a peak rate of about 5.30% in September after the central bank’s decision, while the December 2023 contract’s rate jumped to about 5.20%.
The yield on two-year Treasuries oscillated widely — rallying as much as 13 basis points in the wake of the Fed’s decision and release of officials rate projections. Those gains were soon pared as Fed chairman Jerome Powell made clear that the July gathering would be a “live” meeting.
The yield on two-year Treasuries traded in a wide range, rising as much as 13 basis points in the wake of the Fed’s decision and release of officials rate projections. Those gains were soon pared as Fed chairman Jerome Powell made clear that the July gathering would be a “live” meeting.
The Dollar Index
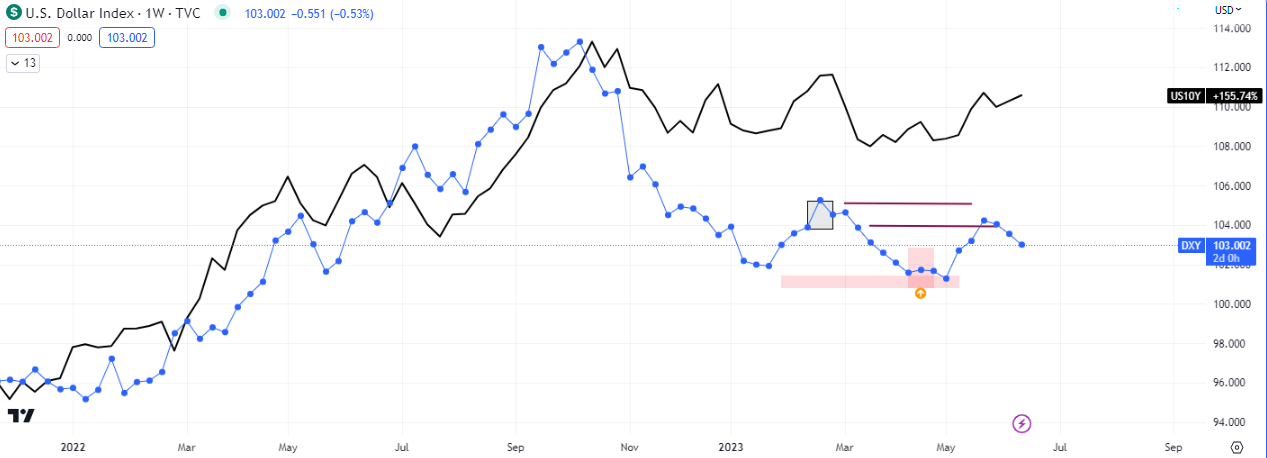
The $DXY, shown above, has been declining since late 2022, and so has the positively correlated US 10Y treasury. A spread has evolved and it is probably going to close, resulting in a higher run up into liquidity in the US Dollar.
Volatility Index
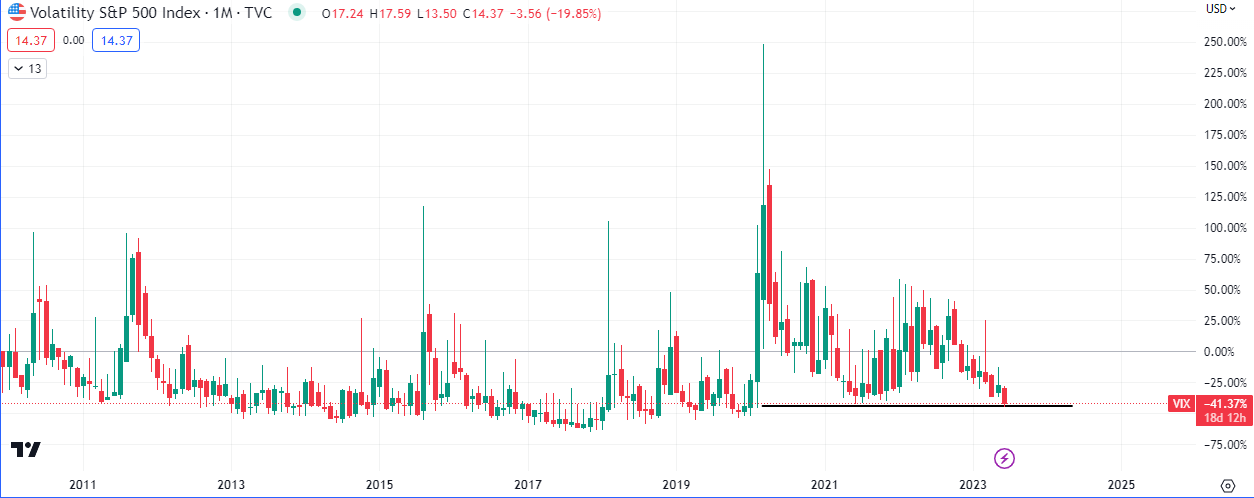
The chart shows the $VIX navigating through lows set in 2020. These moves in 2020 were the most volatile percentage gains in 14 years on the index. Historically speaking this is a bearish extreme that will probably react upwards.
The weekly chart has a slight exhaustion from last week’s on it, but Friday’s close, if it closes bullish, will give the confirmation for a spike up to test resistance. A bearish close on Friday would however point to lower prices on the $VIX and, consequently, a continuation of the rally on equities.


Leave a Reply