

The composite PMI Output Index of a country tracks the business trends across both manufacturing and service sectors. The index is based on data collected from a representative panel of over 1,000 companies and tracks variables such as new orders, sales, inventories, employment and prices. 60% of the index is made up of manufacturing companies, while 40% is for the services sector.
A reading above 50 indicates expansion in business activity while a reading lower than 50 indicates contraction. A rising PMI below 50 shows a slowing contraction, a falling PMI below 50 show accelerating contraction. A dropping PMI above 50 shows slowing growth and expansion and a rising one shows acceleration and expansion.
Traders use this data in their analysis to gauge the strength of stock markets and currencies and it can be very useful, when considered in the right context. Below, we take a look at some of the recent composite PMI readings for some of the world’s largest economies and the effects on their currencies.
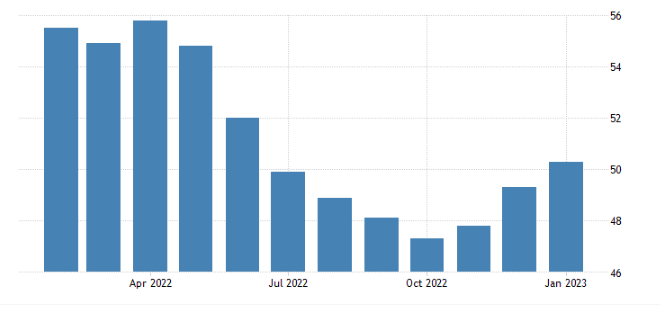
United States
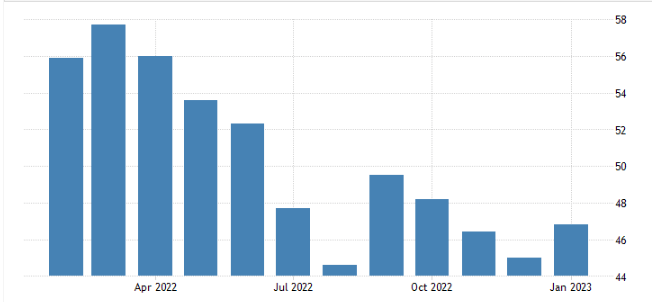
“The S&P Global US Composite PMI was revised slightly higher to 46.8 in January 2023, up from a preliminary estimate of 46.6 and above December’s four-month low of 45.0. The latest reading pointed to a softer contraction in the US private sector, as both manufacturing and service sectors shrank at slowest rates. Total new orders fell modestly in January, amid weak domestic and foreign client demand, while backlogs of work continued to decline. In addition, employment rose only marginally. On the price front, the rate of cost inflation ticked higher, while increases in selling prices moderated again.” source: Markit Economics
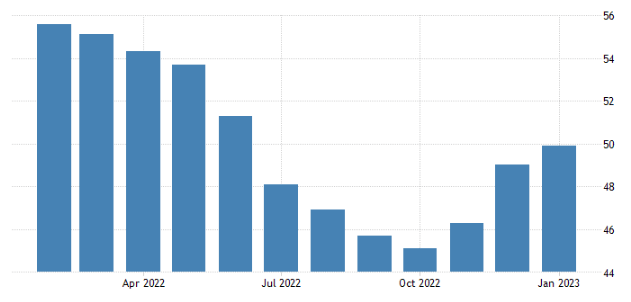
United Kingdom
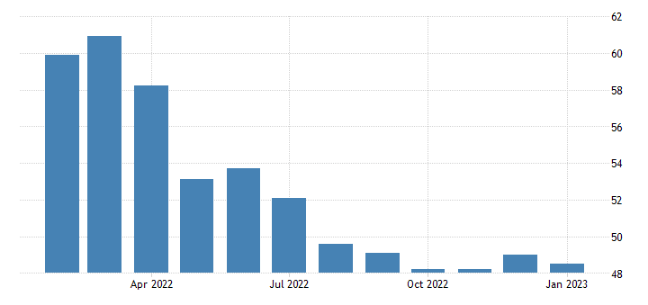
The S&P Global/CIPS UK Composite PMI went down to 48.5 in January of 2023 from 49 in December but above preliminary estimates of 47.8. The latest reading pointed to the sixth consecutive contraction in private sector, the longest period of continuous decline since the global financial crisis in 2008/09. However, the rate of contraction was only modest in January. Manufacturing production continued to decline more quickly than service sector activity. That said, manufacturing output fell at the slowest pace since July 2022, while the latest service sector performance was the weakest for two years. Private sector employment was broadly unchanged in January as job creation in the service economy was offset by another solid decrease in payroll numbers at manufacturing firms. Meanwhile, input cost inflation moderated to its lowest since May 2021, with both manufacturers and service providers reporting softer price pressures at the start of the year. source: Markit Economics
Australia
The Judo Bank Australia Services PMI revised higher to 48.6 in January 2023, from preliminary estimates of 48.3, compared to 47.3 in the previous month. It marked a fourth consecutive month of contraction in services as the index remained below the 50.0 neutral level. Private sector slowdown eases mostly due to an increase in demand. Higher new orders and new business growth pushed employment levels higher across manufacturing and service sectors. Meanwhile, firms in the private sector continued to face higher costs, but the slowest rate since October 2021 and pushed the selling prices higher. source: Markit Economics
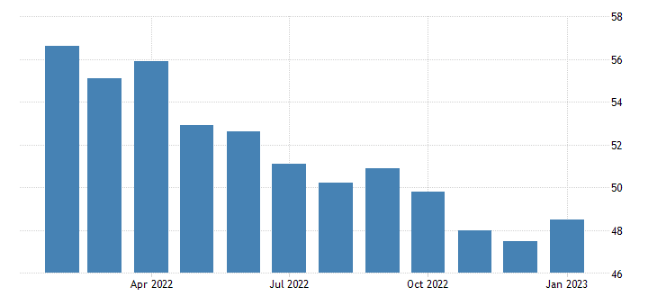
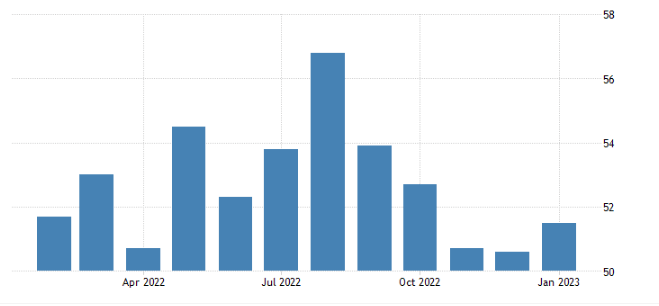
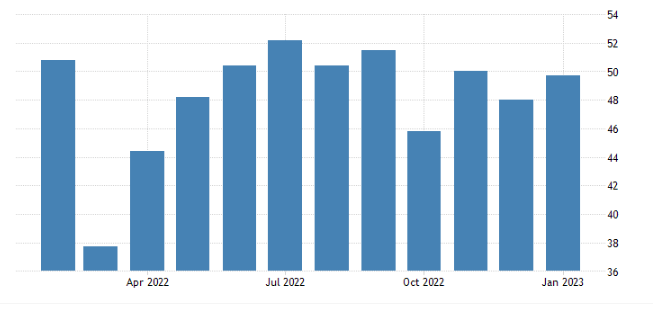
Japan
The au Jibun Bank Japan Composite PMI was at 50.7 in January 2023, compared with the flash figure of 50.8 and after a final 49.7 a month earlier. This was the highest reading since last October, marking the first expansion in private sector activity in three months. Growth was centered on the service sector, where activity increased for the fifth consecutive period and at a faster pace thanks to the National Travel Discount Programme. Meanwhile, factory activity continued falling, but its decline rate eased to a three-month low. New orders moved closer to stabilization, and employment stagnated after growing for 23 months. At the same time, backlogs of work expanded for the first time in three months. On the cost side, input price inflation was at a 3-month peak due to a quicker rise in the service sector and an elevated cost in the manufacturing economy. Output prices have advanced at the slowest pace since March 2022. Finally, sentiment eased to a nine-month low. source: Markit Economics
Euro Area
The S&P Global Eurozone Composite PMI stood at 50.3 in January 2023, slightly up from a preliminary estimate of 50.2 and compared with December’s 49.3. The latest reading pointed to the first month of expansion in the bloc’s private sector since June 2022, helped by a rebound in services activity and the weakest pace of contraction in manufacturing since last August. Total new orders fell for the seventh successive month, but the rate of decline was the softest over this period, while the rate of job creation ticked slightly higher to a three-month high. At the same time, backlogs of work decreased, particularly in the manufacturing sector. On the price front, input cost inflation continued its downward trend, easing to a 21-month low, although output prices increased at a slightly faster clip in January. Finally, business confidence improved to a nine-month high. source: Markit Economics
Germany
Germany, also a part of the EU, is such an economic force that investors sometimes use it’s composite PMI as an economic gauge for the entire Euro area.
The S&P Global Germany Composite PMI was revised higher to 49.9 in January of 2023 from a preliminary of 49.7, pointing to a stagnation in private sector activity, after six straight months of contraction. The services sector rebounded (50.7 vs 49.2) and manufacturing contracted less (47.3 vs 47.1). Demand conditions nevertheless remained challenging, with inflows of new work falling across both monitored sectors, albeit at slower rates. On the price front, a notable slowdown in cost inflation contrasted with a slightly quicker rise in average prices charged. Business confidence meanwhile perked up, with expectations at their highest since the Russian invasion of Ukraine. This in turn supported a further rise in private sector employment, with the rate of job creation even picking up slightly to a five-month high. source: Markit Economics
New Zealand
The BusinessNZ Performance of Composite Index for New Zealand rose to 51.5 in January 2023, up from an upwardly revised 50.6 in the previous month, as the service sector activity expanded at a faster pace and manufacturing output returned to growth. source: Business New Zealand
China
The Caixin China General Composite PMI climbed to 51.1 in January 2023 from 48.3 in the previous month. It was the first growth in private sector activity since last August, buoyed by the removal of harsh pandemic measures. An expansion in services activity for the first time in five months mainly supported the upturn while the manufacturing sector became a drag. New orders returned to growth, though the rate of increase was marginal; the downturn in new export work eased, and employment fell the least in three months. On the price front, input cost rose the most in six months, while prices charged were broadly stable. Lastly, confidence improved to the joint-highest in nearly a decade. “There is still uncertainty in how the pandemic will develop, so full preparation should be made to deal with the next wave of the virus,” said Dr. Wang Zhe, an economist at Caixin Group. “China will still need to effectively coordinate pandemic containment with economic and social development.” source: Markit Economics
Russia
The S&P Global Russia Composite PMI increased to 49.7 in January 2023 from 48.0 in the previous month. Still, this was the third straight month of contraction in private sector activity, amid a further decrease in service sector output which offset an expansion in manufacturing production. New orders fell for the second straight month, while weak foreign client demand led to another fall in new export orders. Meantime, job shedding at service providers outweighed a solid upturn in manufacturing employment as private sector firms signaled a further decline in workforce numbers, amid a sixth successive monthly fall in backlogs of work. On prices, input cost was higher due to rising supplier and wage costs as both manufacturers and service providers recorded greater cost burdens. In an effort to boost sales, however, output charges rose at a softer rate. source: Markit Economics
How to use the Composite PMIs to trade
From the data above we can see that some of the largest economies in the world have been expanding, while some been contracting. My cross referencing a contracting economy with an expanding one, traders may be able to find trading and investment opportunities.
United States:
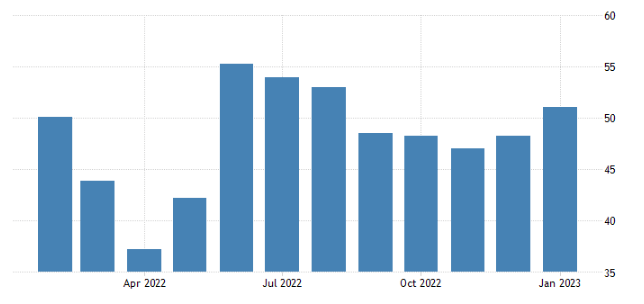
USDJPY
The pairing of the US Dollar and the Japanese Yen is a prime example for the narrative.
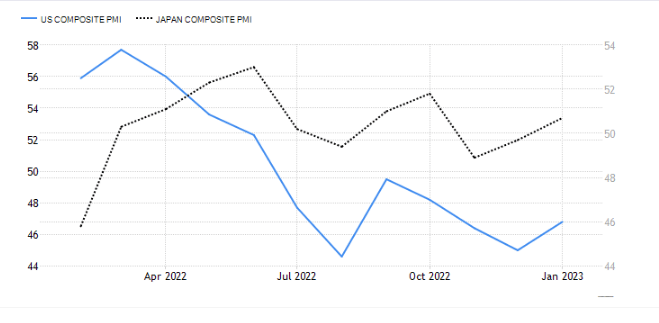
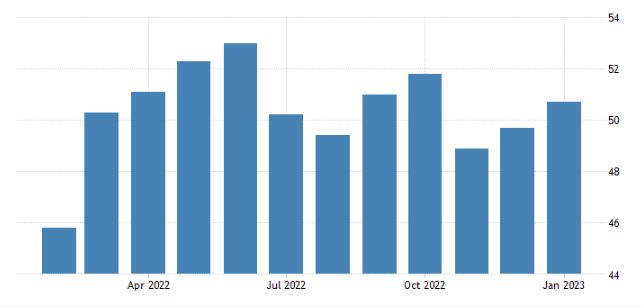
The Japanese economy fared batter than the US’ through large swaths of 2022, as seen in the chart above.
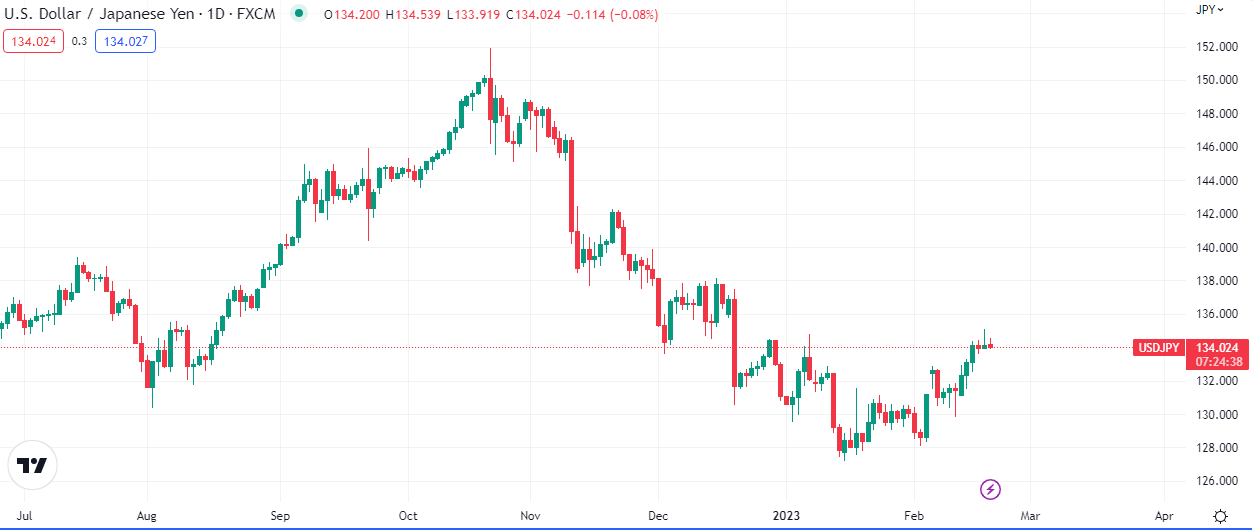
The currency pair, USDJPY, was marked down from October to January. Although there were other factors responsible for the direction of the market, the Composite PMI was a fundamental component in the equation.

Leave a Reply