

The “Wall of worry” is the financial markets’ periodic tendency to surmount a host of negative factors and keep ascending.
“AI chasing”, a boom in the artificial intelligence industry has catalyzed a wave of strength in the tech sector. A look at some of the technicals and fundamentals shows that the debate about the market rally from the October 2022 lows, can be ‘moderated’ smartly. Is it a resumption of the 2009 bull market trend or an extended bear market rally?
There is no simple answer, however there are ‘signposts’ we can use as guides.
The bearish case remains compelling;
Interest Rates (+)
Debt Levels (+)
Economic Activity (-)
Given higher interest rates, increased debt levels, and slowing economic activity, the bears remain lurking. Majority of analysts think the US economy will enter a recession in the next 6 months
However, the bulls can also make a compelling case;
Technical Market Structure (+)
Improving Earnings (+)
200-Week Moving Average (+)
50-Week Moving Average (+)
$SPX, $NDAQ and $DOW have been making higher highs as $VIX declined over the past 7 months, with buyers coming in consistently at higher prices. The $DOW has been a slight exception, with a 4 week decline over the past month.
Improving earnings are an added positive confluence supportive of the rally narrative. Technically, the correction from January 2022 to the long-term bullish trend line of the 200-week moving average is complete. With the market holding that support and moving above the 50-week moving average provides further validation.
Fundamentally, earnings are expected to grow rapidly through the end of 2023 and break above the 2022 peak.
A strong technical and fundamental recovery in earnings must result from an economic expansion, however the current economic data contradicts this narrative.
A closer look at the technicals can give us some key liquidity levels to watch out for continuations or reversals inline with whichever narrative comes out on top.
Advantage to the bulls, curtsey of mega-capitalization stocks
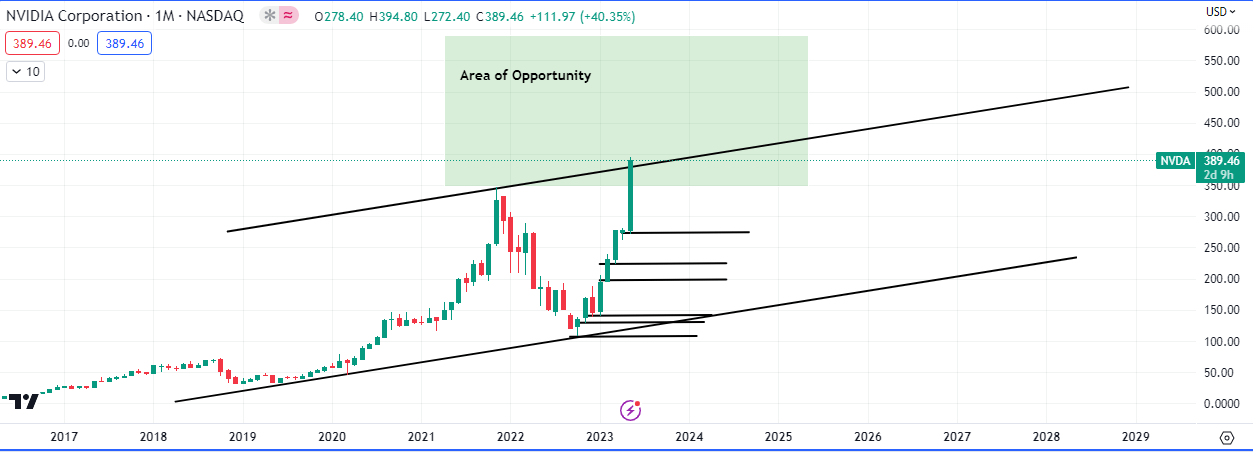
$NVDA depicts the strength being witnessed in the tech sector perfectly. The semiconductor company who is leading in AI supercomputing, has broken its all time high strongly and may be poised to rally as high as $590.
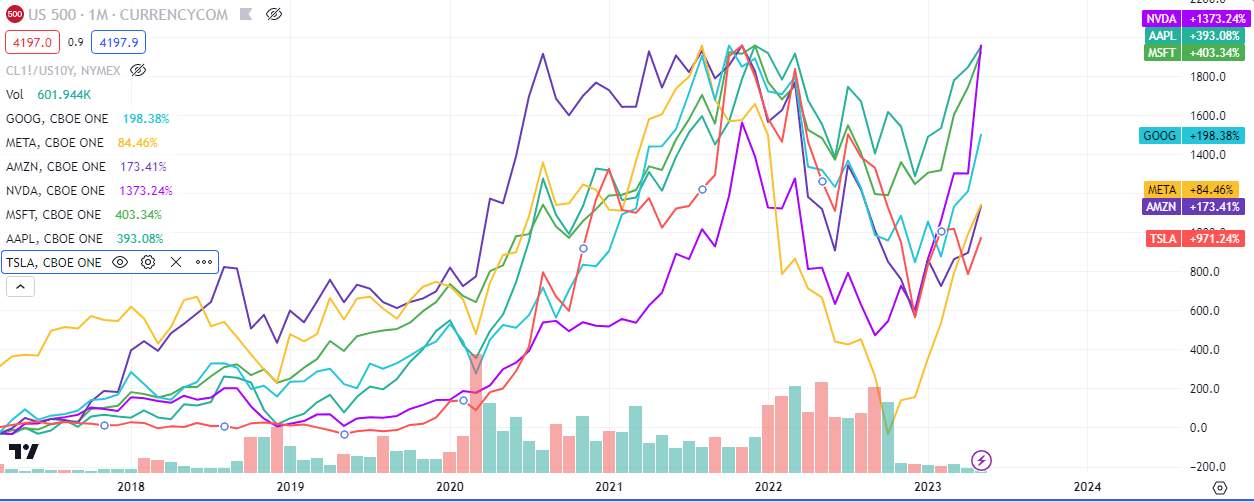
A cursory comparison of some of the biggest tech companies shows $NVDA, $MSFT and $AAPL leading the way. $TSLA and $META still have some way to go, in terms of record share pricing.
The bulls are clearly in control of the market currently. However a closer look shows that the advance is being led by a narrow group of highly capitalized companies, particularly in the technology sector. Visualizing the disparity in participation is clear between the market capitalization performance and equal-weighted indices
The narrowness of the market advance could go awry if it doesn’t broaden out. However, the rally can last longer, and remain irrational, to the bears at least, as FOMO (Fear of Missing Out) keeps the rally going.
The more the market rallies, the more it weighs on bearish investors until they eventually capitulate and puke/cover their short positions. The conversion of bearish sentiment fuels a rally in the short term. Despite the rally from the October lows, there remains a significant level of negative investor sentiment in the market.
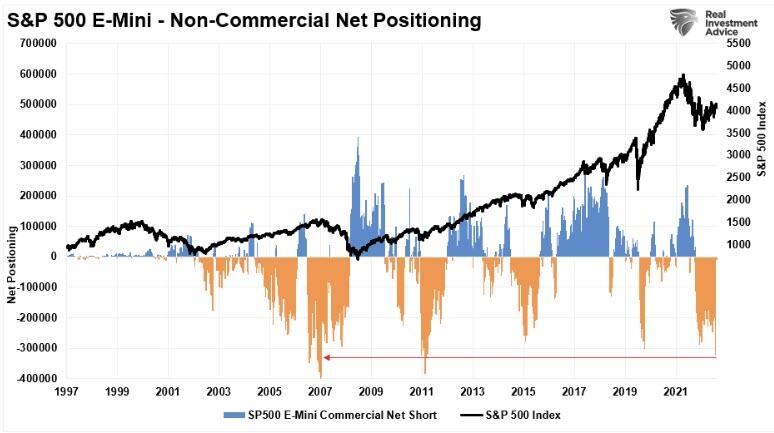
There are also massive levels of short positions by Non-Commercial speculators against the S&P 500. Such an extreme is another source of potential buying to support a further rise, as short seller will be forced to cover their positions as their stops get run over.
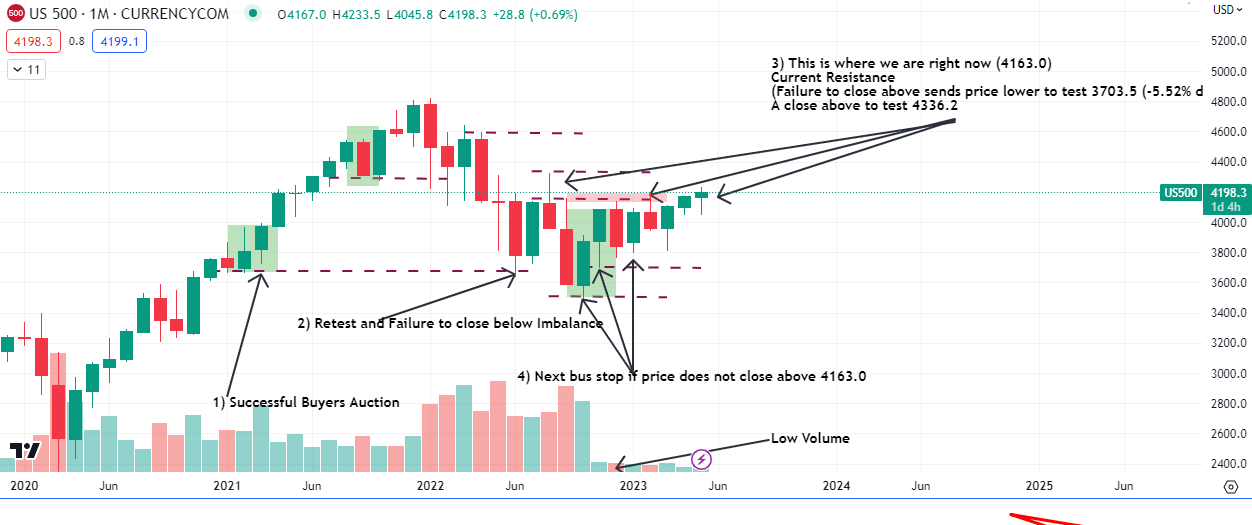
The chart above shows the markups we made some weeks ago, highlighting the key areas of liquidity.
Currently, the key resistances above are;
4326.9
4596.4
4640.1
4819.7
If or when each of these technical levels gets taken out, such will force more buyers into the market, driving higher prices. That cycle will repeat until something eventually gives way. Until then, the bulls are clearly in control on a technical basis.
The bullish technology trade is absorbing the bulk of inflows as every other market sector still remains under pressure. This is due to the continued economic and fundamental outlooks of weaker growth, bank stress, and higher rates.
Historically speaking, wide divergences between short-term technical trends and fundamental realities do not last indefinitely. At some point, a market rotation will occur as the realities dawn.
Another issue for the technology trade is that it is a bet on disinflation, given that technology stocks are long-duration assets. However, since inflation has remained “stickier” than expected, and the divergence between technology stocks and bond prices is quite extreme. When you combine this with the narrow breadth of the strength being witnessed, skepticism in the current rally is understandable and healthy.
While there are many reasons to be bearish on the markets, it is essential to remember that “stocks climb a wall of worries.

Leave a Reply