

The Whales have been busy in US Stocks, as usual, indices have continued to make upward advances toward their all-time highs, we take a look at some of the key technical levels, liquidity, above and below today’s prices.
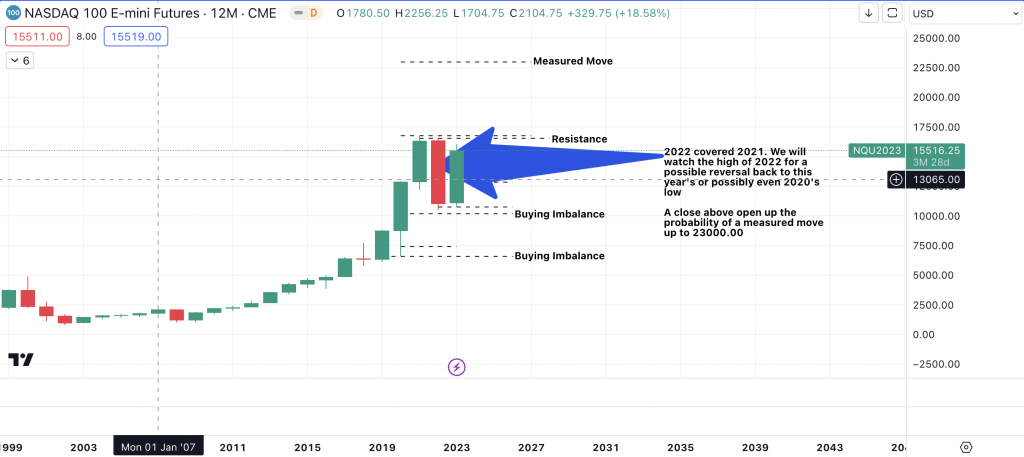
The yearly chart on the Nasdaq futures market (NQ1!) shows that there is a likelihood that the tech index has room for some downside towards the lows of 2020. However price is more likely to sweep sell stops at the all time high first or even possibly at the measured move above the all time high.
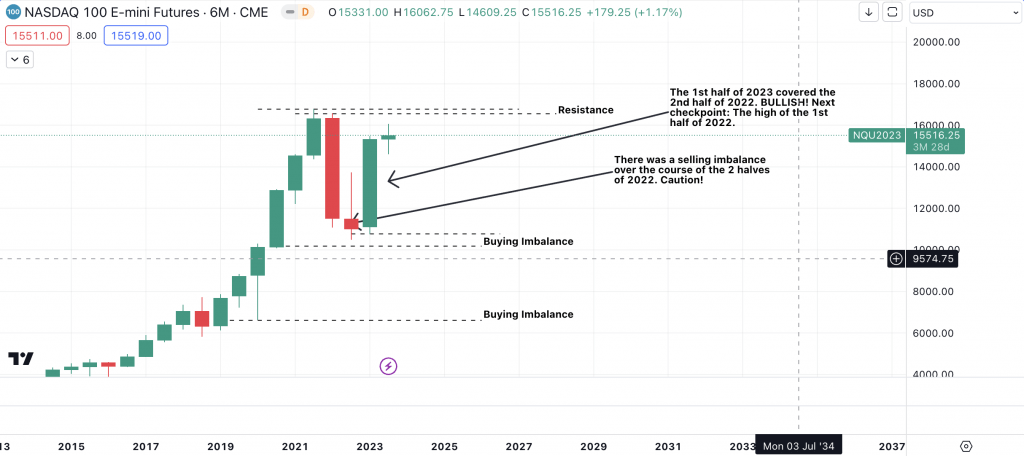
A similar situation is evident on the lower timeframe on the 6 month chart above.
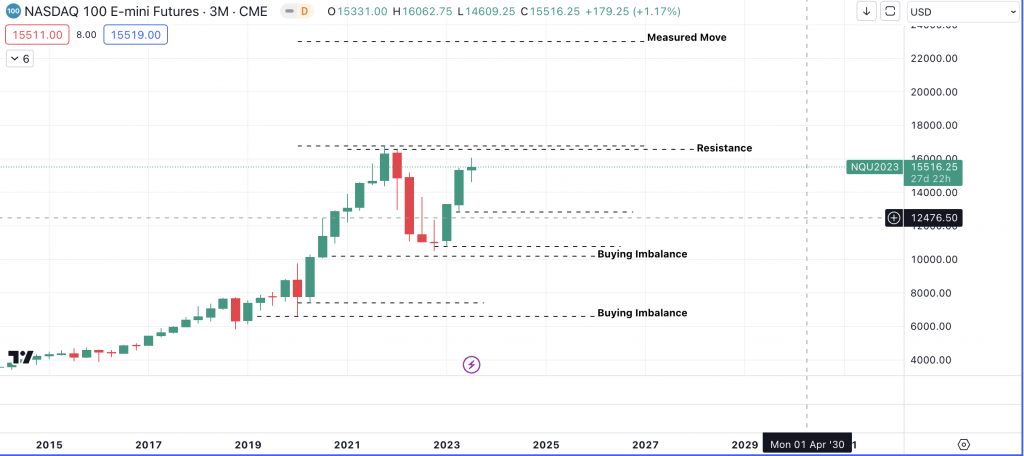
Much more of the same narrative on the 3 month (quarterly) charts.
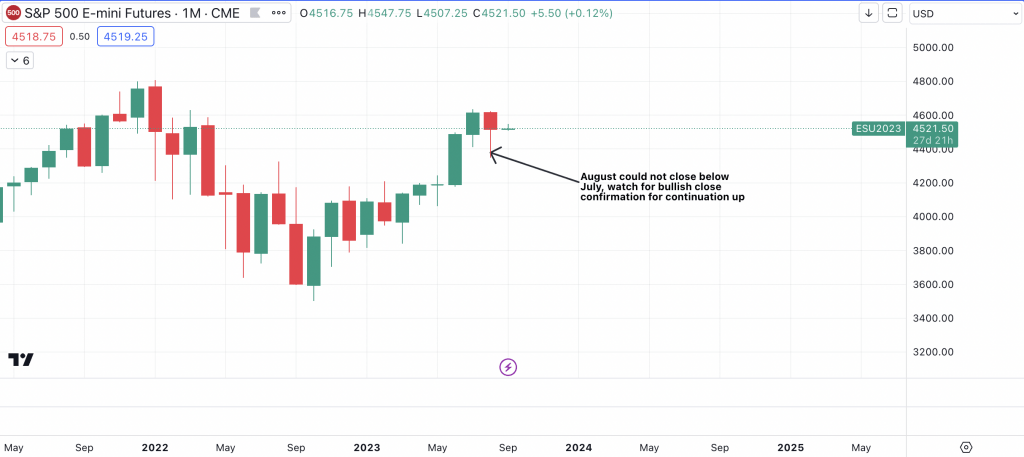
Last month could closed rather bullish but we need to see how this month closes for more insight on momentum.
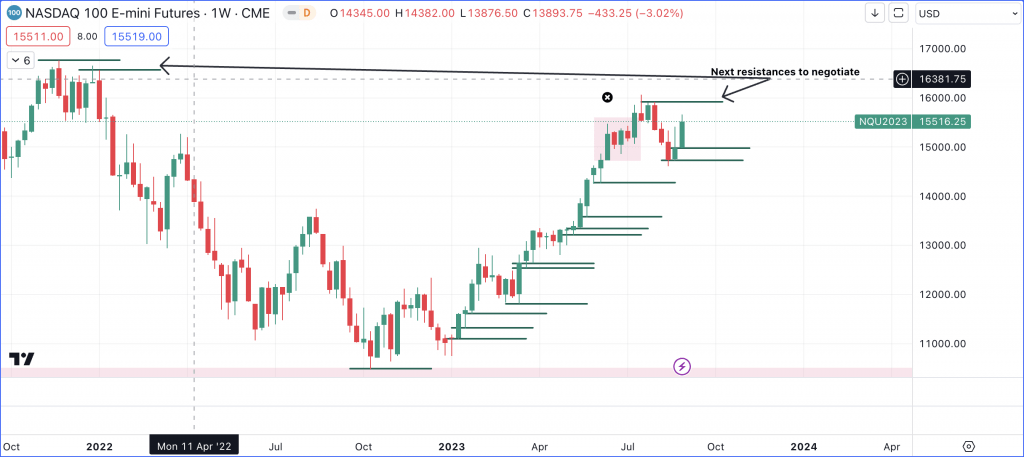
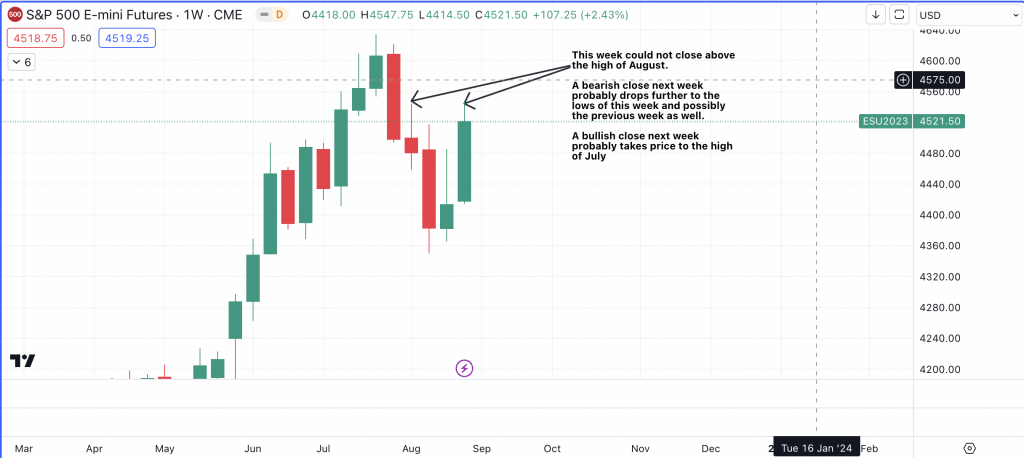
The weekly chart has a more bearish narrative in the background, with a failed buying auction in a critical supply level. The caveat to this is that last 2 weeks have closed higher and managed to ‘cover the highs of 3 and 4 weeks ago. This is bullish but we must watch out for the next 3 resistance levels before the all time high for a possible failure.
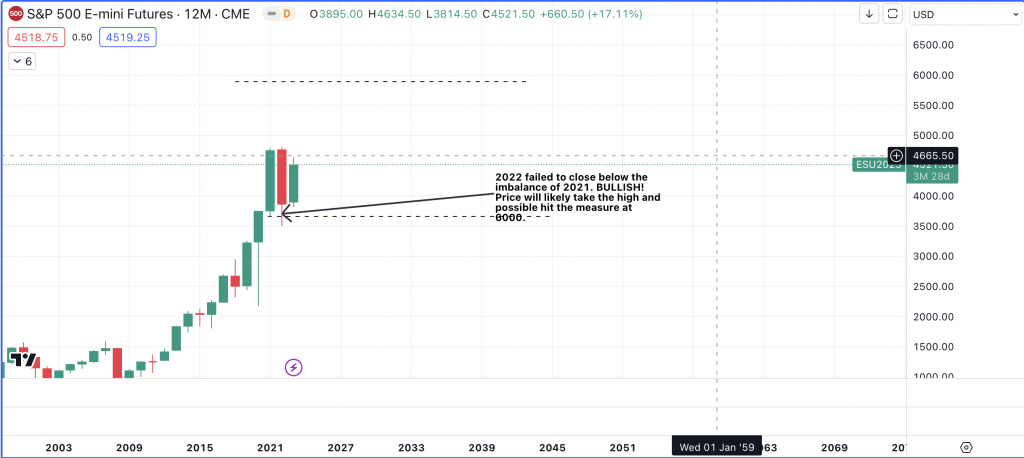
The yearly on the S&P500 looks very bullish and a bullish close this year will make it even more so. A measured move above the all time high is quite likely on this one.
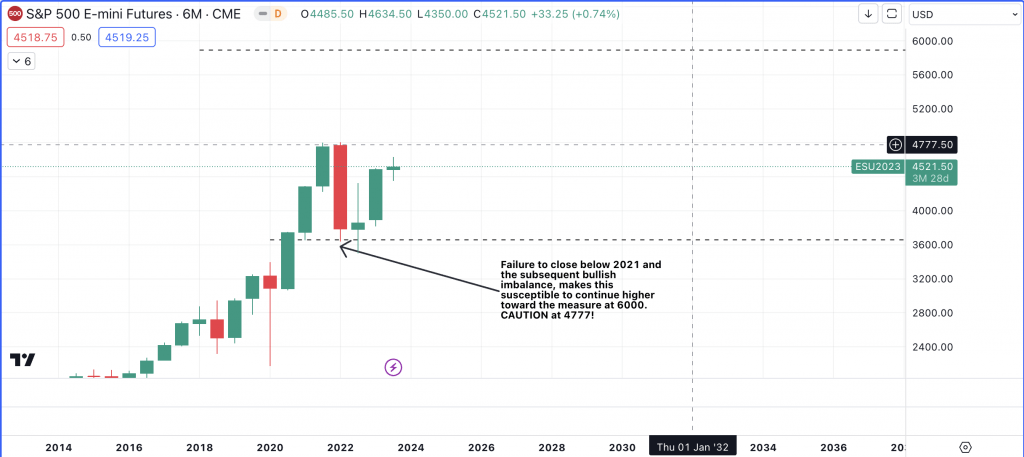
The 6 month chart shows a vert bullish situation has occurred and a sweep of the all time high is likely on the cards.
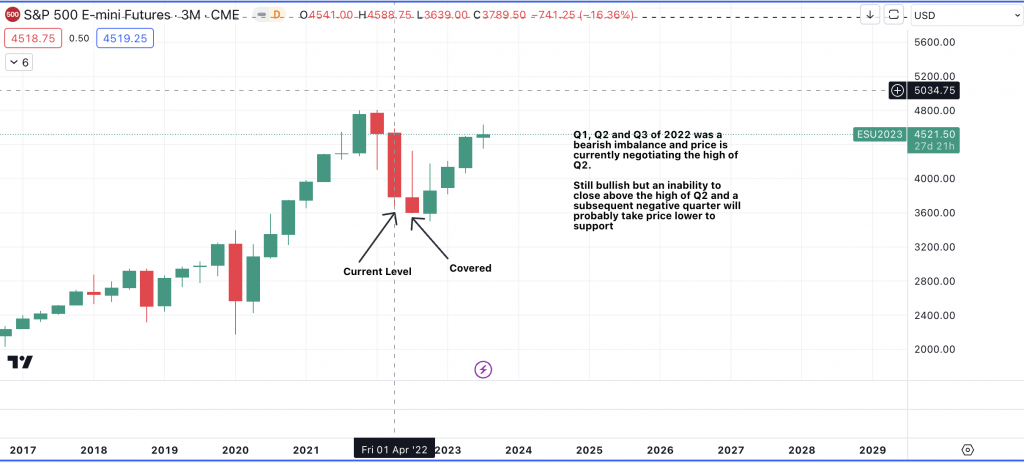
The quarterly chart may still act as a trip-wire against the bulls as price approaches the high of April 2022.

The Monthly has a bullish signature.
The weekly must still close above the bearish imbalance candles of last year to avoid any deep drops.
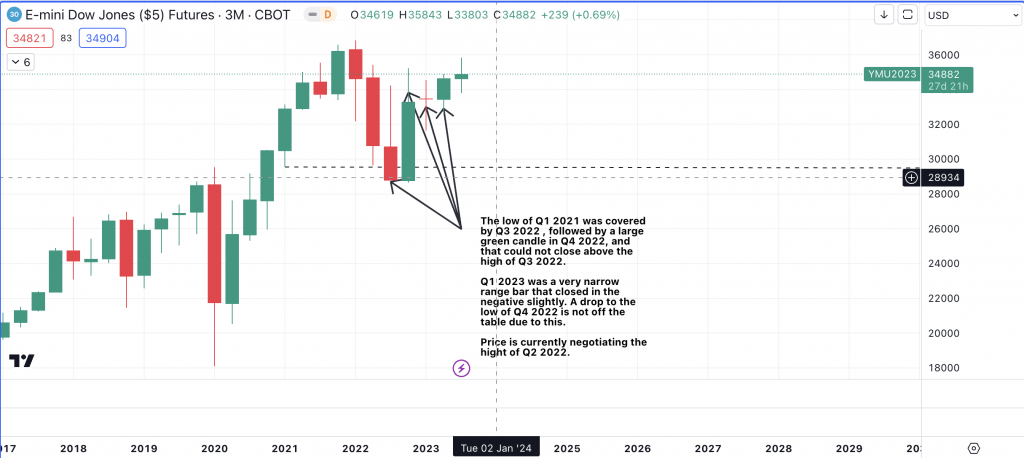
The DOWJONES (YM1!) quarterly chart offers an olive branch to the bears, as Q1 closed slightly bearish, although price has since continued higher we may still see a reversal.
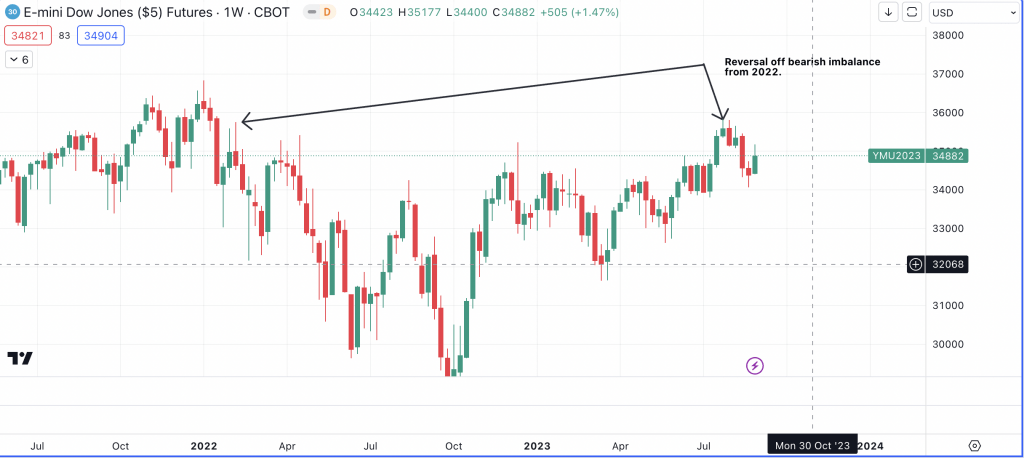
Could a lower restest be possible on the weekly?
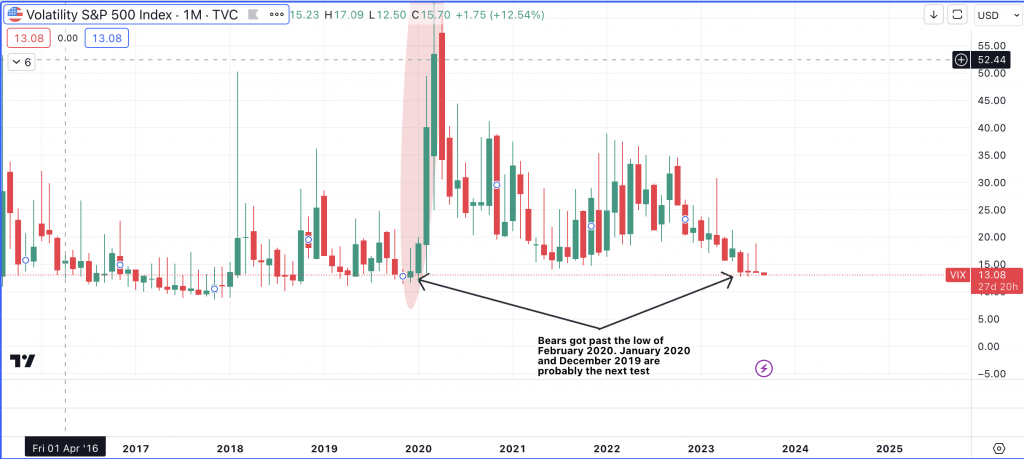
Although the fear index ($VIX) is at the lows of 2020, sellers continue to come in. A sharp rise is very likely to occur sooner or later.
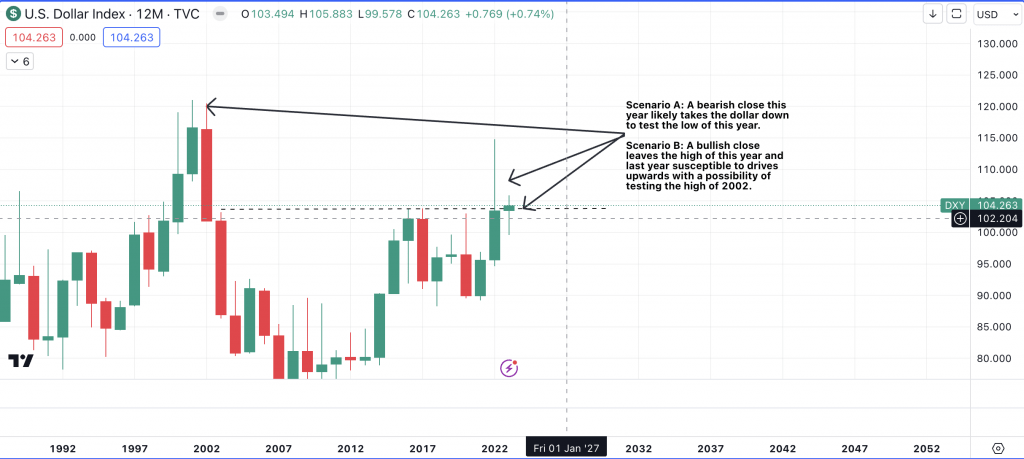
The green back is also at a crossroad on it’s yearly chart, directional confirmation will be made at the end of the year.
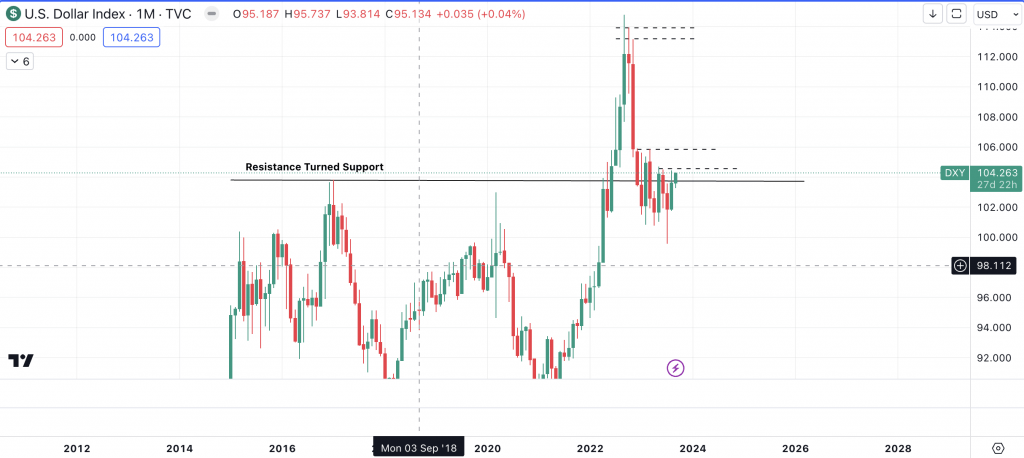
Price is approaching a resistance point on the Monthly. Push through or reject?
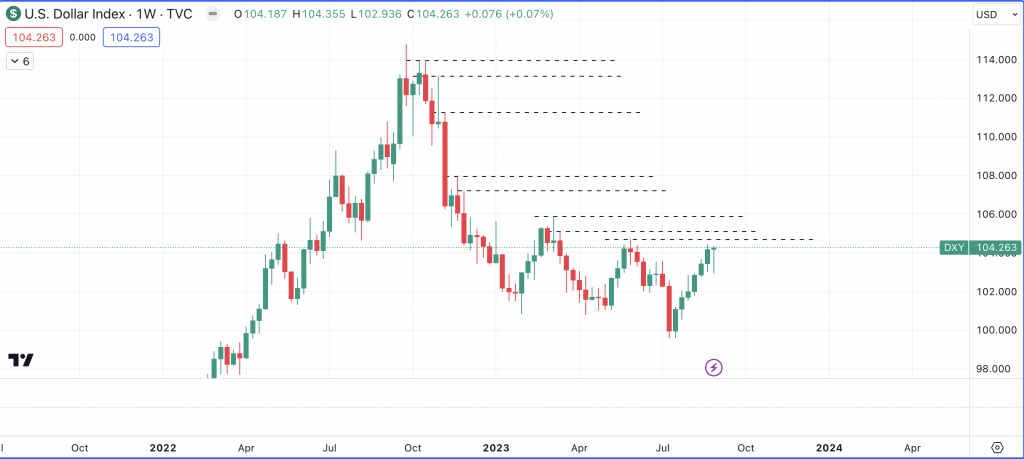
The Weekly chart suggest more upside but we are close to a resistance test.
With investors starting to confidently price in the possibility of a rate cut, the possibility of a surprise is becoming elevated, although the technicals remain bullish for now.

Leave a Reply