
Volatility and the Dollar take center stage this week as the S&P500 ($SPX) makes a bid for a third consecutive weekly close.
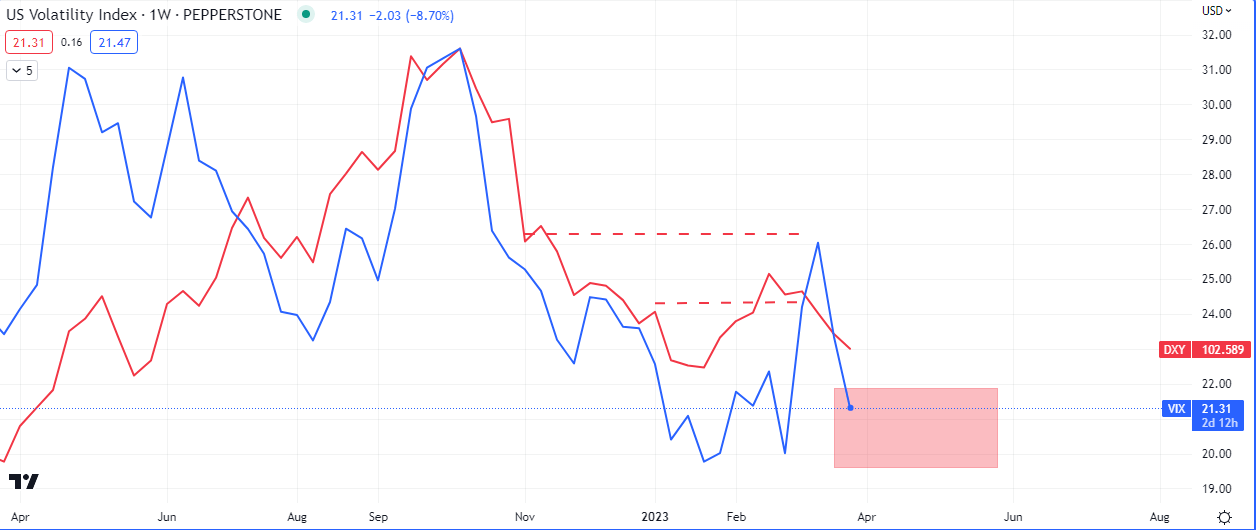
Given, the macro economic tailwinds buffeting US Dollar and the ‘fear’ index’s continued weakness from last week, the $SPX has responded positively and is 0.74% up in the early ours after the London open.
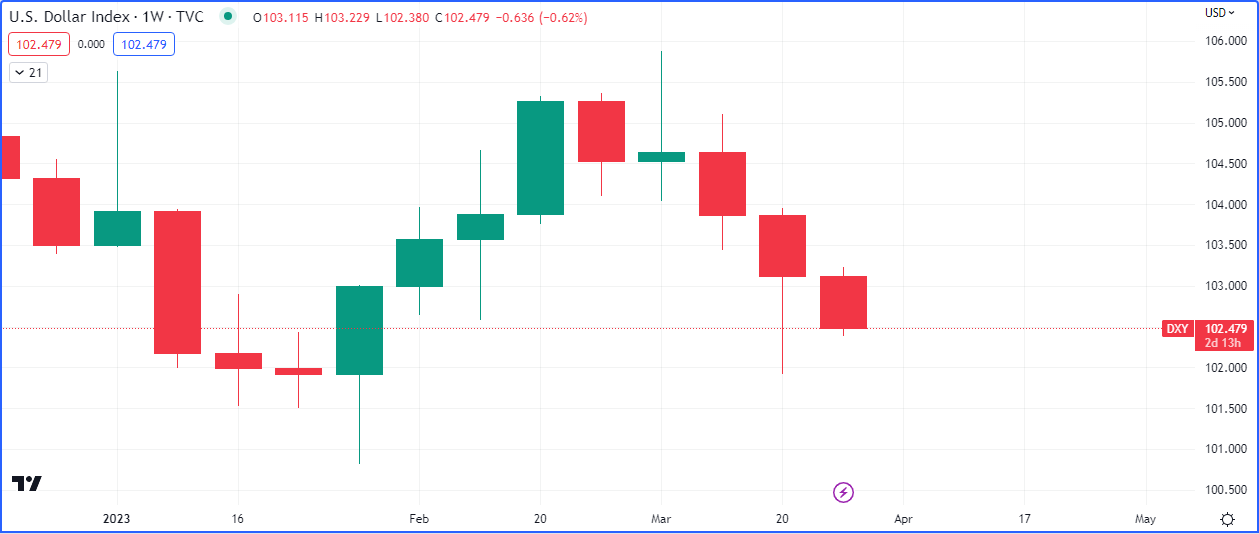
Our view that the Dollar needed to sweep the lows of last week Friday and possible Thursday, has played out. Next the bullishness in the weekly and monthly levels means the dollar is now approaching key lows that may rebuff the descent.
Will the Fed hike rates despite the shaky banks? Are the bailouts actually working? How are the institutions responding to the situation? How the Fed balances the need to fix their flailing attempt at taming inflation, and keeping the equity markets bid remains to be seen.
This week’s close is an important one for the Dollar as a bullish close sets up a possible markup to 104.00 on $DXY.
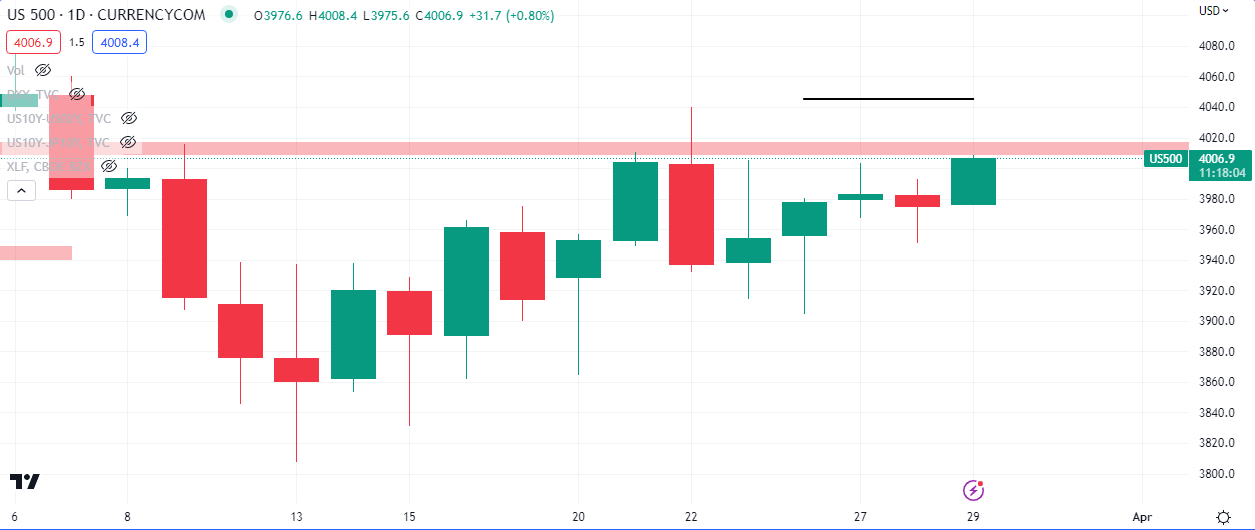
Yesterday’s close on $SPX set the index up for today’s rally, if the day closes bullish then the sentiment for Thursday or/and Friday will be bullish. This would be in line with the narrative for a lower Dollar and volatility. The Nasdaq ($NDAQ), which had been lagging the $SPX and $DOW, is up 0.83% this morning.
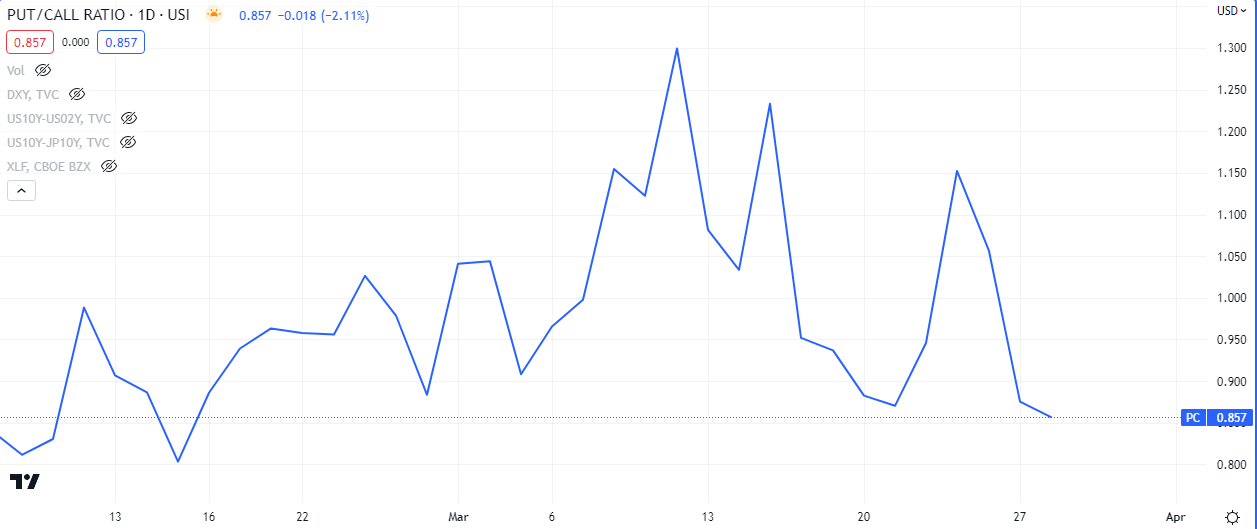
Call options are being bought at a much faster rate than put options.
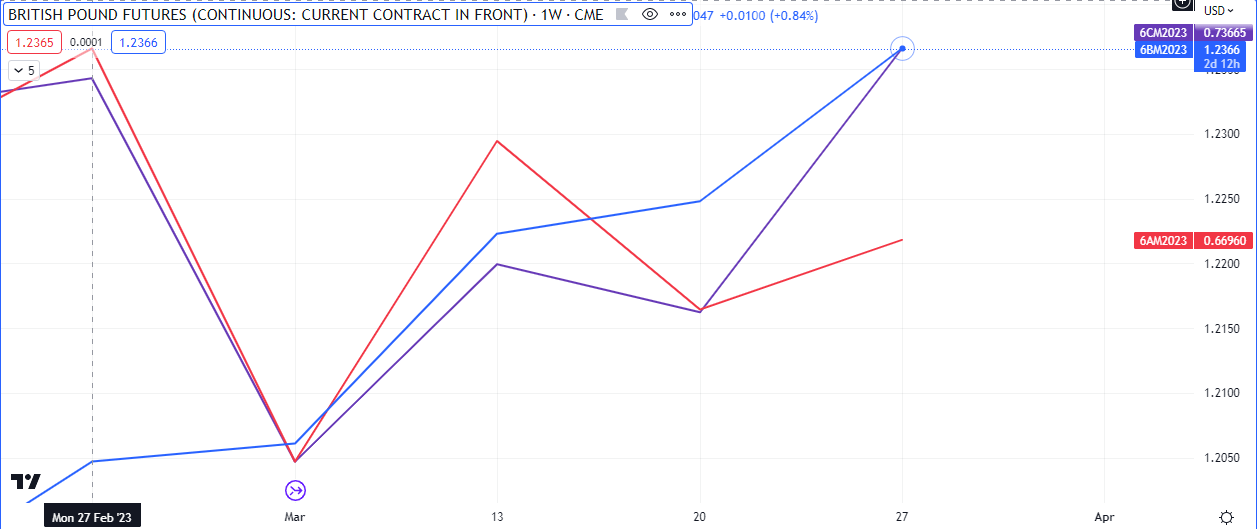
High beta, risk on, currencies are currently in an uptick on the week, as explained here. The rally on oil is buoying the CAD and AUD, being major exporters. Currently trading at $74/barrel on the WTI benchmark, the next liquidity point is $77.
Let’s take a look at what the metals traders were up to…
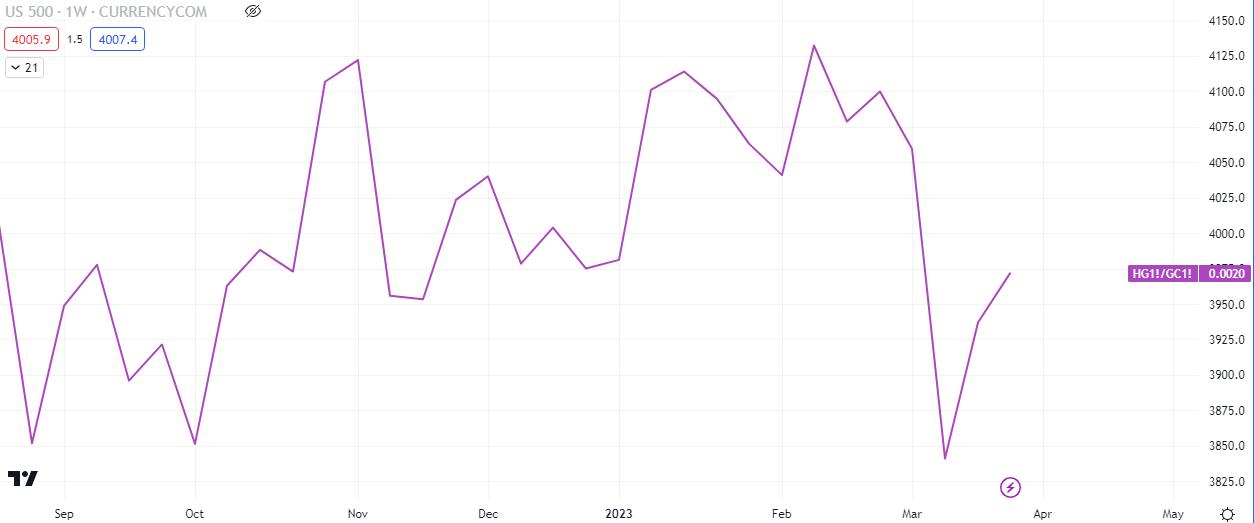
Metals traders were selling copper and buying gold this quarter, with a slight tilt back to buying copper and selling gold through most of this month so far. This has a positive correlation with equities and equities are currently leading as the spread closes.
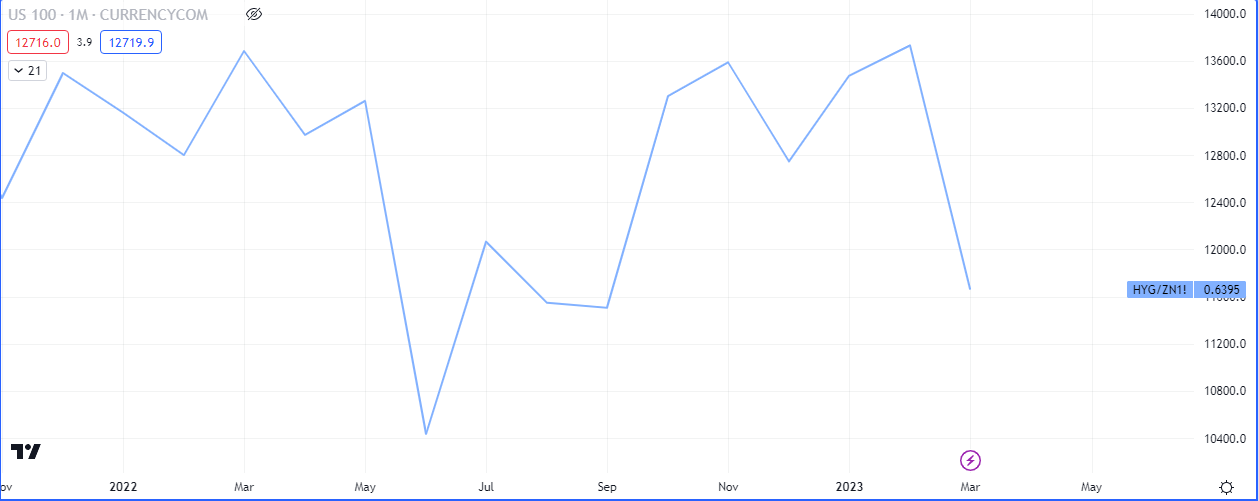
There appears to be an exodus from High Yield corporate bonds into 10Y government debt. This is bearish for equities.


Leave a Reply