

US stock indices, led by $SPX, recovered some lost ground today as US core durable goods orders and new home sales came out better than forecasted. Durable goods orders, however, came in negative on poor reports from Boeing. Orders for manufactured goods sank 4.5% in January largely because of a pullback in volatile passenger jet bookings, but business investment rose at the fastest pace in five months in a sign of strength for the economy.
Economic polls by the Wall Street Journal had forecasted a 3.6% drop in orders for durable goods. These are products like cars and computers meant to last at least three years. Yet if transportation is set aside, new orders rose 0.7% last month. What’s more, a key measure of business investment rose at the fastest pace since last summer.
DXY was down on the day to the tune of -0.59% after 4 consecutive days of bullish closes.
US Equities
Last week’s -2.6% drop in the $SPX looks likely to be recovered in March, if the indications of price action are anything to go by. Last week, the price of the stock index dropped but could not close below the bullish imbalance that occurred on the 23rd of January, 2023. The next piece of information that would likely imply a move upwards on the weekly chart is a close above the Weekly open of 3969.2.
-Weekly-
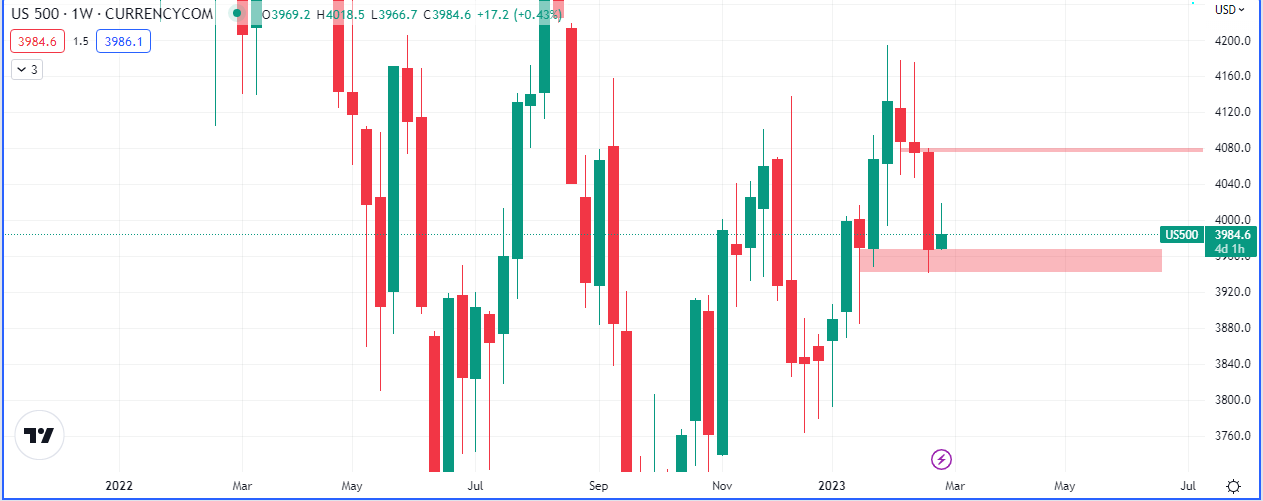
On the flipside of the coin, a close below the weekly close renders the index more bearish with the target for a drop below 3870.0.
-Monthly-
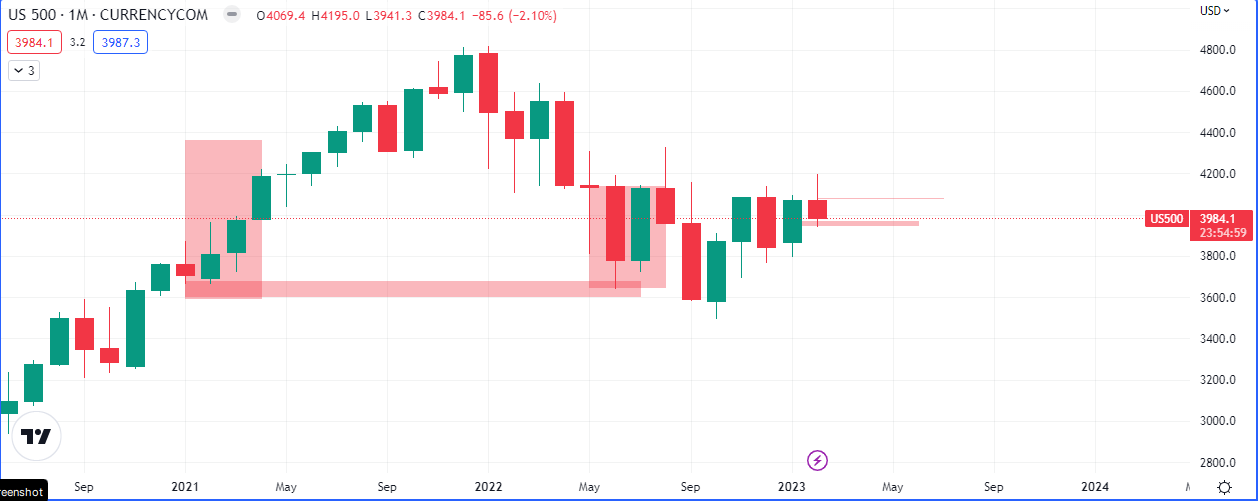
With the bullish close from June 2022 below February 2021’s open, our positive expectancy for $SPX still remains intact despite the shape of the accumulation and 4400 is the target for this expected rally. This is actually contrary to the evidence being presented by inflation numbers and the FEDs body language. We will follow the lower timeframes to the outcome of this setup.
-Daily-
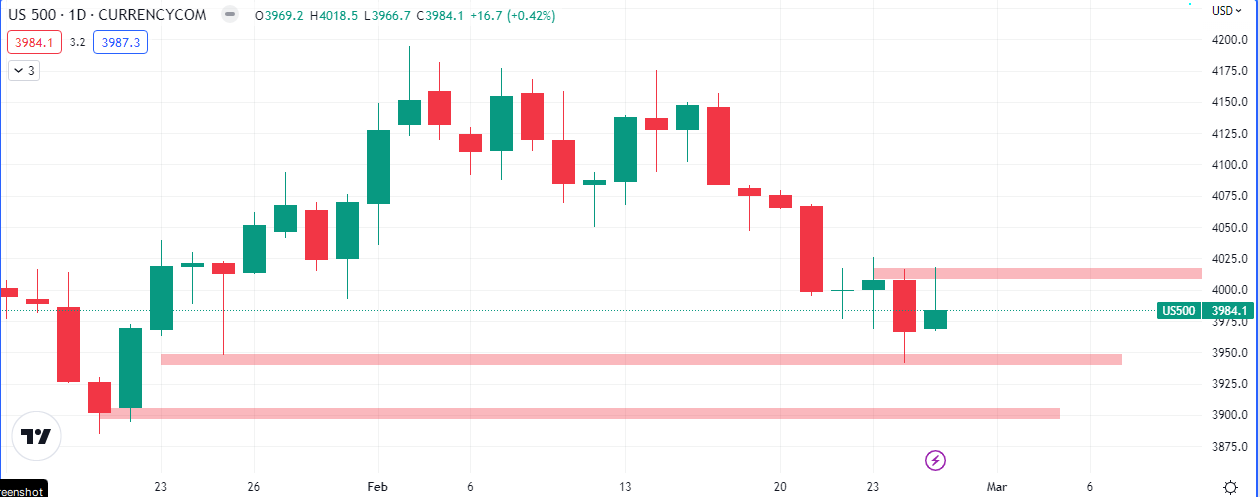
Today’s close makes yesterday’s low and the 22nd of January’s the next likely destination of price over the next couple of day’s. Our intraday sentiment, barring other macro values, is bearish going into tomorrow’s trading session.
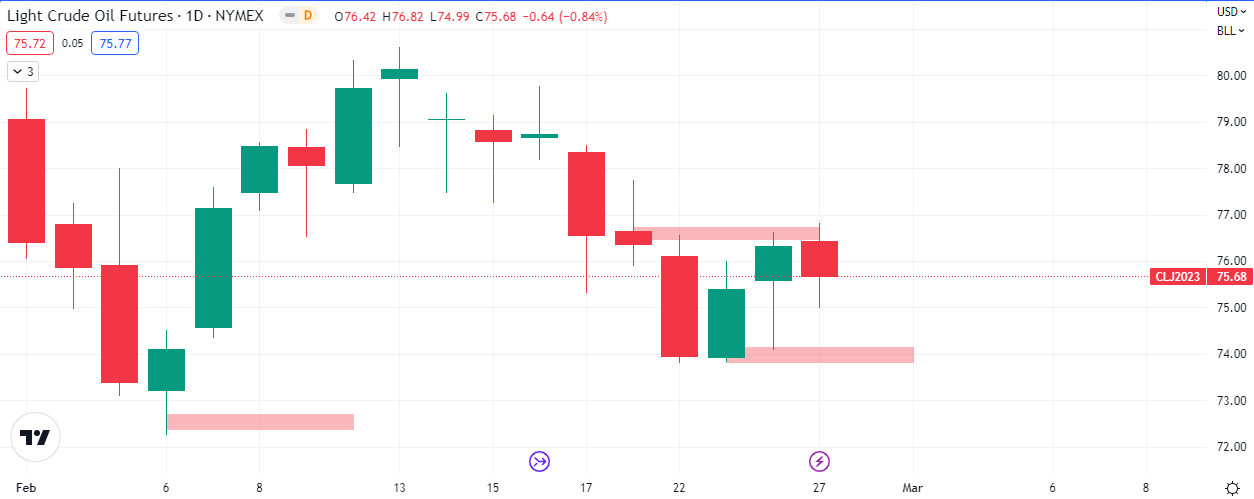
Oil
The benchmarks closed lower today and traders are looking forward to crude oil, distillate, gasoline and natural gas inventory numbers expected on Wednesday and Thursday.
Price could not close above last week Wednesday’s high, making a retest of $73.80 likely, as indicated in the chart below.
For more of our expectations for the week, watch the video below.
To understand more about how we view the markets, read this article on risk on and risk off.


Leave a Reply