

The volatility index ($VIX) is in the cross hairs today as it closed to the downside on the weekly and daily timeframes. The ramifications of the bearish close on the weekly can be found in this article.
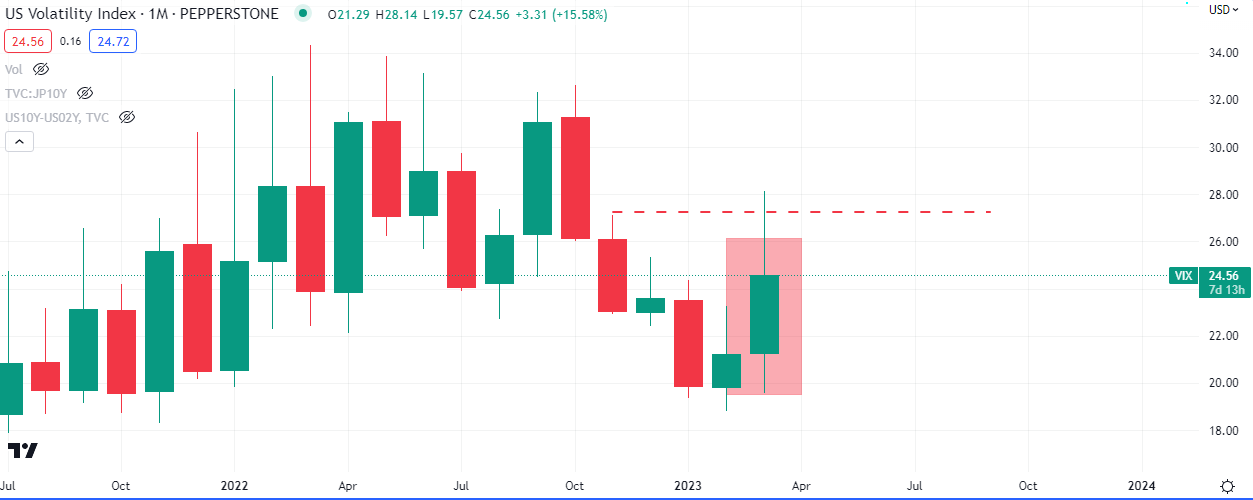
In the monthly chart below, this month’s candle is still in progress, as it wicked through sell side liquidity. The monthly close next week Friday will give us more information on a directional bias on the monthly.
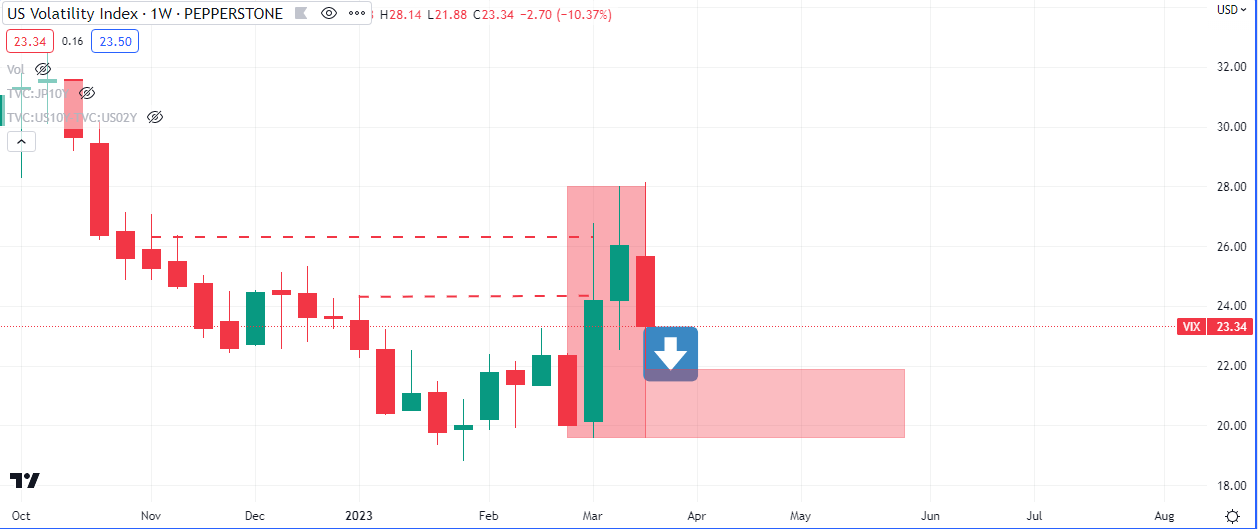
The weekly timeframe offers some insight on what we can expect in the stock indices next week and possibly further. Price closed below the open of the week after last week could not close above previous selling volume. This should see the $VIX drop over the next week or further out, with bullish ramifications for $SPX, $NDAQ, $DOW and $RUA.
Some bullish pressure is evident in the market structure, especially in the price range from 2 weeks ago, but any bullish pressure will be seen on the lower time frames, should they try to take hold.
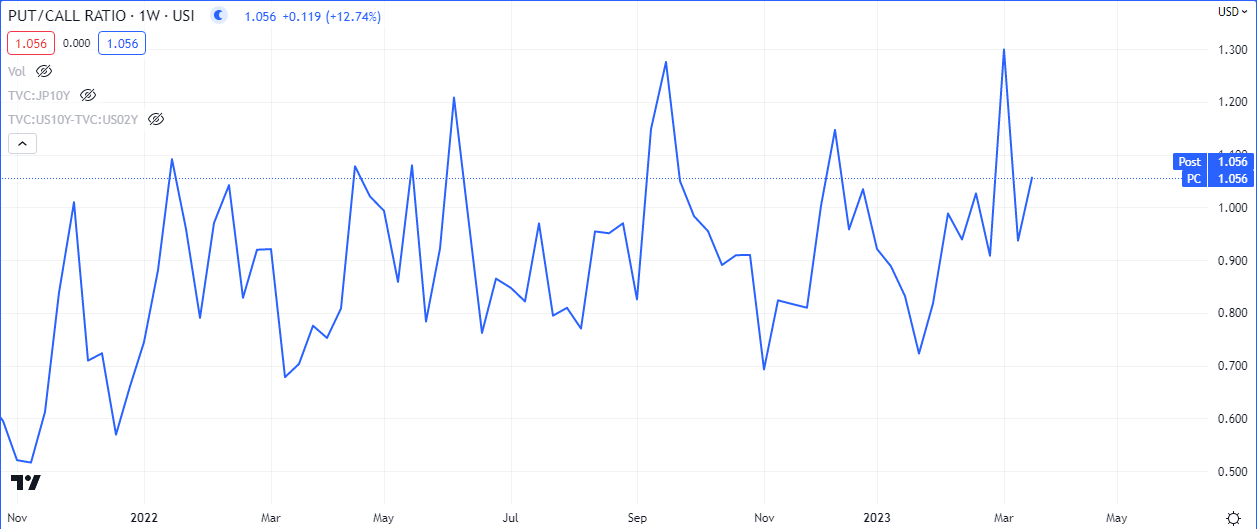
The PC Ratio shows a 12% increase in the ratio between put options and call options, after an initial 27% drop. Could this be short covering in a risk off environment?
The tech heavy $NDAQ led the indices higher with a 2.2% appreciation on the weekly timeframe. The implications of a further drop in volatility and put options are that we should see higher prices on US equities.
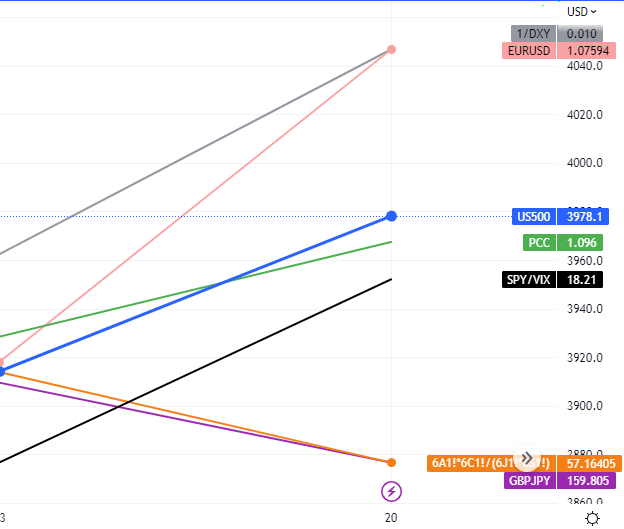
Some risk on currencies (high beta currencies) closed lower in spite of the higher close on equities and some relative dollar weakness. It is worth noting that the 10Y treasury bonds of the Aussie, Cad and Pound made gains against the 10Y bonds of the Yen and Swiss Franc. This order flow could lead to some appreciation in the high beta currencies next week if risk on flows kick in.
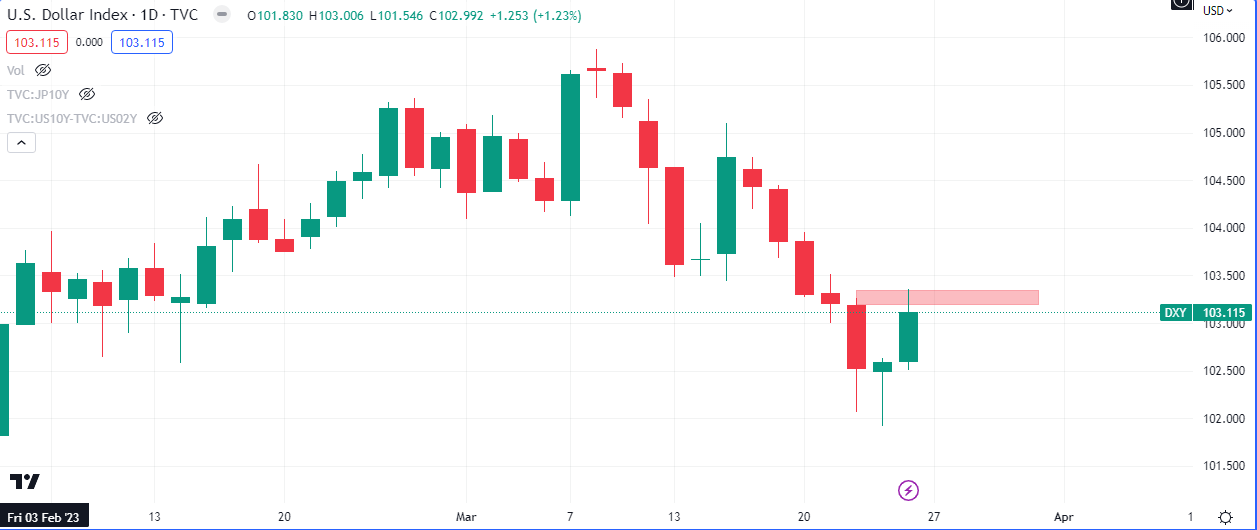
The US Dollar has a good chance of revisiting the lows of Friday and Thursday next week if the worries from the banking sector reemerge. The price action already suggest that but a bullish close on Monday would be very bullish and that could weaken equities.
The bearish close on the volatility index, while facing some opposition from some of the data points discussed above, has some support in form of emerging risk on flows in the bonds of some commodity backed currencies. If the Yen weakens and the dollar does not catch a bid we could see US equities rally next week.


Leave a Reply